
Page 392 - Clinical Application of Mechanical Ventilation
P. 392
358 Chapter 11
Circuit Leaks
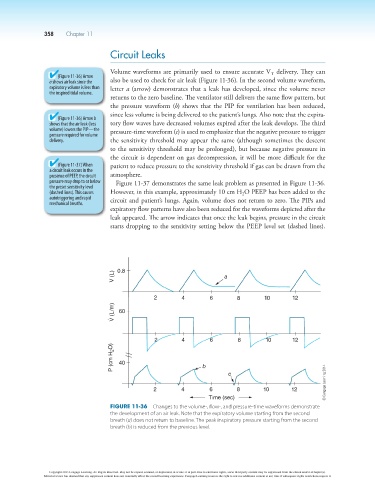
Volume waveforms are primarily used to ensure accurate V delivery. They can
(Figure 11-36) Arrow T
a shows air leak since the also be used to check for air leak (Figure 11-36). In the second volume waveform,
expiratory volume is less than letter a (arrow) demonstrates that a leak has developed, since the volume never
the inspired tidal volume.
returns to the zero baseline. The ventilator still delivers the same flow pattern, but
the pressure waveform (b) shows that the PIP for ventilation has been reduced,
since less volume is being delivered to the patient’s lungs. Also note that the expira-
(Figure 11-36) Arrow b
shows that the air leak (less tory flow waves have decreased volumes expired after the leak develops. The third
volume) lowers the PIP—the pressure-time waveform (c) is used to emphasize that the negative pressure to trigger
pressure required for volume
delivery. the sensitivity threshold may appear the same (although sometimes the descent
to the sensitivity threshold may be prolonged), but because negative pressure in
the circuit is dependent on gas decompression, it will be more difficult for the
(Figure 11-37) When patient to reduce pressure to the sensitivity threshold if gas can be drawn from the
a circuit leak occurs in the
presence of PEEP, the circuit atmosphere.
pressure may drop to or below Figure 11-37 demonstrates the same leak problem as presented in Figure 11-36.
the preset sensitivity level
(dashed lines). This causes However, in this example, approximately 10 cm H O PEEP has been added to the
2
autotriggering and rapid circuit and patient’s lungs. Again, volume does not return to zero. The PIPs and
mechanical breaths.
expiratory flow patterns have also been reduced for the waveforms depicted after the
leak appeared. The arrow indicates that once the leak begins, pressure in the circuit
starts dropping to the sensitivity setting below the PEEP level set (dashed lines).
0.8
V (L) a
2 4 6 8 10 12
V (L/m) 60
2 4 6 8 10 12
P (cm H 2 O) 40
b
c
2 4 6 8 10 12 © Cengage Learning 2014
Time (sec)
Figure 11-36 Changes to the volume-, flow-, and pressure-time waveforms demonstrate
the development of an air leak. Note that the expiratory volume starting from the second
breath (a) does not return to baseline. The peak inspiratory pressure starting from the second
breath (b) is reduced from the previous level.
Copyright 2013 Cengage Learning. All Rights Reserved. May not be copied, scanned, or duplicated, in whole or in part. Due to electronic rights, some third party content may be suppressed from the eBook and/or eChapter(s).
Editorial review has deemed that any suppressed content does not materially affect the overall learning experience. Cengage Learning reserves the right to remove additional content at any time if subsequent rights restrictions require it.