
Page 390 - Clinical Application of Mechanical Ventilation
P. 390
356 Chapter 11
expiratory time is shorter compared to average conditions for ventilator patients
(dashed line).
Gas Trapping and Uncounted Breathing Efforts
Gas trapping can easily be recognized by examining the volume-time waveform.
In air trapping, the expired volume is less than the inspired tidal volume (i.e., the
expired volume curve does not reach baseline). This observation may occur for one
or more breaths. The trapped air typically comes out along with a normal tidal-
volume breath resulting in a larger expired tidal volume than inspired tidal volume
(i.e., the expired volume curve extends below the baseline). This cycle may repeat as
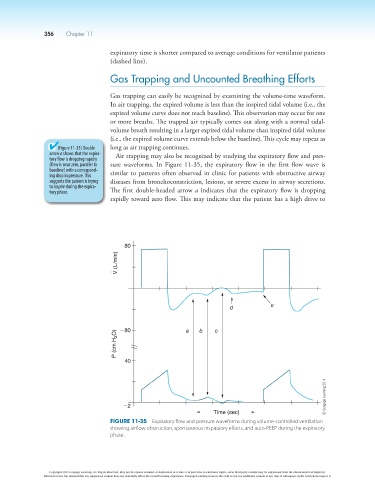
(Figure 11-35) Double long as air trapping continues.
arrow a shows that the expira- Air trapping may also be recognized by studying the expiratory flow and pres-
tory flow is dropping rapidly
(flow is near zero, parallel to sure waveforms. In Figure 11-35, the expiratory flow in the first flow wave is
baseline) with a correspond-
ing drop in pressure. This similar to patterns often observed in clinic for patients with obstructive airway
suggests the patient is trying diseases from bronchoconstriction, lesions, or severe excess in airway secretions.
to inspire during the expira-
tory phase. The first double-headed arrow a indicates that the expiratory flow is dropping
rapidly toward zero flow. This may indicate that the patient has a high drive to
80
V (L/min)
d e
P (cm H 2 O) 280 a b c
40
© Cengage Learning 2014
22
Time (sec)
Figure 11-35 Expiratory flow and pressure waveforms during volume-controlled ventilation
showing airflow obstruction, spontaneous inspiratory efforts, and auto-PEEP during the expiratory
phase.
Copyright 2013 Cengage Learning. All Rights Reserved. May not be copied, scanned, or duplicated, in whole or in part. Due to electronic rights, some third party content may be suppressed from the eBook and/or eChapter(s).
Editorial review has deemed that any suppressed content does not materially affect the overall learning experience. Cengage Learning reserves the right to remove additional content at any time if subsequent rights restrictions require it.