Page 394 - Clinical Application of Mechanical Ventilation
P. 394

360    Chapter 11


                                                 800


                                                 600                                  PIP
                                                                                      Peak P ALV
                                                Volume (mL)  400                      P AO


                                                 200
                                                                         P TA
                                                                                                               © Cengage Learning 2014


                                                                10       20  25  30       40      50       60
                                                   Assist Breath          Pressure (cm H 2 O)

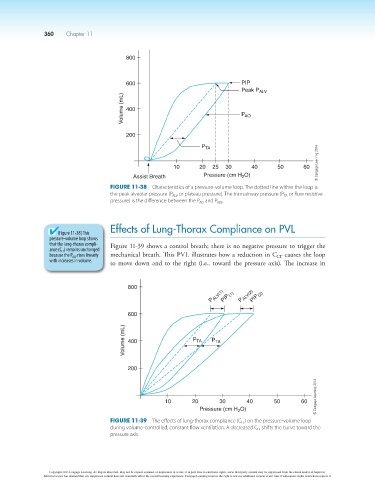
                                            Figure 11-38  Characteristics of a pressure-volume loop. The dotted line within the loop is 
                                            the peak alveolar pressure (P ALV  or plateau pressure). The transairway pressure (P TA  or flow resistive 
                                            pressure) is the difference between the P AO  and P ALV .


                                            Effects of Lung-Thorax Compliance on PVL
                          (Figure 11-38) This
                        pressure-volume loop shows
                        that the lung-thorax compli-  Figure 11-39 shows a control breath; there is no negative pressure to trigger the
                        ance (C LT ) remains unchanged
                        because the P ALV  rises linearly   mechanical breath. This PVL illustrates how a reduction in C  causes the loop
                                                                                                  LT
                        with increases in volume.  to move down and to the right (i.e., toward the pressure axis). The increase in


                                                 800
                                                                            P ALV(1)  PIP (1)  P ALV(2) PIP (2)


                                                 600
                                                Volume (mL)  400       P TA  P TA


                                                 200

                                                                                                               © Cengage Learning 2014


                                                             10       20       30       40       50       60
                                                                         Pressure (cm H O)
                                                                                     2
                                            Figure 11-39  The effects of lung-thorax compliance (C LT ) on the pressure-volume loop 
                                            during volume-controlled, constant flow ventilation. A decreased C LT  shifts the curve toward the 
                                            pressure axis.


                        Copyright 2013 Cengage Learning. All Rights Reserved. May not be copied, scanned, or duplicated, in whole or in part. Due to electronic rights, some third party content may be suppressed from the eBook and/or eChapter(s).
                      Editorial review has deemed that any suppressed content does not materially affect the overall learning experience. Cengage Learning reserves the right to remove additional content at any time if subsequent rights restrictions require it.
   389   390   391   392   393   394   395   396   397   398   399