
Page 397 - Clinical Application of Mechanical Ventilation
P. 397
Ventilator Waveform Analysis 363
800
1 2
600
Volume (mL) 400 Point of Upper Inflection
200 P ALV
© Cengage Learning 2014
10 20 30 40 50 60
Pressure (cm H O)
2
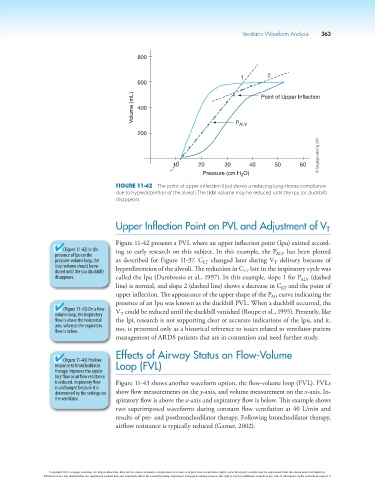
Figure 11-42 The point of upper inflection (Ipu) shows a reducing lung-thorax compliance
due to hyperdistention of the alveoli. The tidal volume may be reduced until the Ipu (or duckbill)
disappears.
Upper Inflection Point on PVL and Adjustment of V T
Figure 11-42 presents a PVL where an upper inflection point (Ipu) existed accord-
(Figure 11-42) In the ing to early research on this subject. In this example, the P has been plotted
presence of Ipu on the ALV
pressure-volume loop, the as described for Figure 11-37. C changed later during V delivery because of
LT
T
tidal volume should be re- hyperdistention of the alveoli. The reduction in C late in the inspiratory cycle was
duced until the Ipu (duckbill) LT
disappears. called the Ipu (Dambrosio et al., 1997). In this example, slope 1 for P ALV (dashed
line) is normal, and slope 2 (dashed line) shows a decrease in C and the point of
LT
upper inflection. The appearance of the upper shape of the P curve indicating the
AO
presence of an Ipu was known as the duckbill PVL. When a duckbill occurred, the
(Figure 11-43) On a flow- V could be reduced until the duckbill vanished (Roupe et al., 1995). Presently, like
volume loop, the inspiratory T
flow is above the horizontal the Ipi, research is not supporting clear or accurate indications of the Ipu, and it,
axis, whereas the expiratory too, is presented only as a historical reference to issues related to ventilator-patient
flow is below.
management of ARDS patients that are in contention and need further study.
Effects of Airway Status on Flow-Volume
(Figure 11-43) Positive
response to bronchodilator Loop (FVL)
therapy improves the expira-
tory flow as airflow resistance
is reduced. Inspiratory flow Figure 11-43 shows another waveform option, the flow-volume loop (FVL). FVLs
is unchanged because it is
determined by the settings on show flow measurements on the y-axis, and volume measurement on the x-axis. In-
the ventilator. spiratory flow is above the x-axis and expiratory flow is below. This example shows
two superimposed waveforms during constant flow ventilation at 40 L/min and
results of pre- and postbronchodilator therapy. Following bronchodilator therapy,
airflow resistance is typically reduced (Garner, 2002).
Copyright 2013 Cengage Learning. All Rights Reserved. May not be copied, scanned, or duplicated, in whole or in part. Due to electronic rights, some third party content may be suppressed from the eBook and/or eChapter(s).
Editorial review has deemed that any suppressed content does not materially affect the overall learning experience. Cengage Learning reserves the right to remove additional content at any time if subsequent rights restrictions require it.