
Page 947 - Hematology_ Basic Principles and Practice ( PDFDrive )
P. 947
830 Part VII Hematologic Malignancies
recombination region. The translocations include a promiscuous by FISH. Two genes on chromosome 4p16.3 and the IGH switch
array of at least 20 nonrandom chromosomal partners. The charac- region on 14q32.3 are involved. The fibroblast growth factor receptor
terization of these translocations has led to the identification of critical 3 gene (FGFR3) is detected on der(14), where it is overexpressed along
dysregulated oncogenes (e.g., BCL2, cyclin D). In each translocation, with a fusion of the MM set domain (MMSET) gene, which is located
a potent enhancer is juxtaposed to dysregulated oncogenes. The five on 4p16.3. This is the first example of a translocation that simultane-
most frequent IGH translocations are t(4;14)(p16.3;q32.3), t(6;14) ously deregulates two genes with oncogenic potential: the FGFR3 gene
(p21;q32.3), t(11;14)(q13;q32.3), t(14;16)(q32.3;q23), and t(14;20) detected on der(14) and the MMSET gene detected on der(4). FGFR3 is
(q32.3;q12) (see Table 56.12 and Fig. 56.50). 50–100 kb telomeric to MMSET. Loss of FGFR3 on der(14) is detected
A recurrent CCND1-IGH rearrangement is characterized by in approximately 20% of cases. A significant number of these patients
overexpression of cyclin D1. In contrast to MCL, breakpoints on have del(13q) within the same clone and are hypodiploid.
11q13 with MM are not clustered but are scattered over a relatively Translocation (14;16)(q32.3;q23) can only be detected with (see
large genomic region. Virtually all MM and MGUS cells have cyclin Fig. 56.50 second row) FISH studies. The incidence of t(14;16) has
D dysregulation, suggesting that this abnormality is an early and been estimated to be approximately 5% of cases. This translocation
unifying pathogenetic event (see Fig. 56.50, first row). In contrast to results in the relocation of the MAF proto-oncogene from its position
other abnormalities involving the IGH locus, t(11;14) MM cells tend on 16q23 to chromosome 14, band q32.3, and it is overexpressed.
to be diploid. There appears to be an association of t(11;14) with an Rare variants t(14;20)(q32;q11)/IGH-MAFB and t(8;20) are included
oligosecretory or light chain form of MM with CD20 expression, within this group because they share a similar gene expression signa-
and a lymphoplasmacytic morphology. This chromosomal rearrange- ture and clinical outcome. Survival of patients with t(14;16) is sig-
ment is the most common genetic lesion in MM (15%–20% of nificantly shorter as compared with patients without t(14;16).
patients with MM) but it has been also observed in MGUS, primary A large number of secondary chromosomal aberrations are found
plasma cell leukemia, and light chain amyloidosis. Two groups of during disease progression. Disease progression is accompanied by
patients with t(11;14) are recognized: one with a rather indolent four main abnormalities including translocations of MYC, the loss or
course and the other associated with a more aggressive course. deletion of chromosome 13, deletions of short arms and amplification
Approximately 15% of patients have a recurrent t(4;14)(p16.3; of long arms of chromosome 1, and the deletion of short arms of
q32.3) abnormality associated with aggressive disease (see Fig. 56.50 chromosome 17. Translocations and/or amplification of MYC (8q24)
third row). This cytogenetic abnormality is associated with IgAλ form may involve up to 45% of patients with an advanced MM, and then
of MM with immature plasma cell morphology, and a poor response cytogenetic study frequently involves very complex nonreciprocal
to therapy. This abnormality is cytogenetically cryptic and is detected rearrangements, duplications, and amplifications. More recent data
based on the CGH- or SNP-array technologies has revealed homo-
zygous deletions such as BIRC2/3 on chromosome 11, deletions of
TABLE Risk Stratification of Myeloma TRAF3 on chromosome 14, and deletions of CYLD on chromosome
56.15 16. Another recurrent double deletion that has been observed in a
A. Standard Risk limited number of the patients occurs on chromosome 1, targeting
Trisomies (hyperdiploidy) the tumor suppressor CDKN2C gene at 1q21 chromosomal site.
t(11;14) Deletion of either band q14 or q14.3 (RB1, DNA marker
t(6;14) D13S319) on chromosome 13 is detected in 10% to 20% of patients
B. Intermediate Risk using conventional cytogenetics and in 50% using interphase FISH.
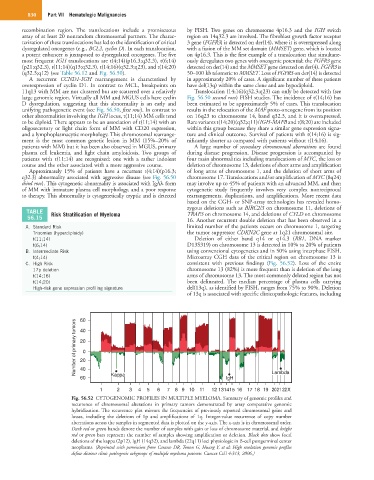
t(4;14) Microarray CGH data of the critical region on chromosome 13 is
C. High Risk consistent with previous findings (Fig. 56.52). Loss of the entire
17p deletion chromosome 13 (82%) is more frequent than is deletion of the long
t(14;16) arms of chromosome 13. The most commonly deleted region has not
t(14;20) been delineated. The median percentage of plasma cells carrying
High-risk gene expression profiling signature del(13q), as identified by FISH, ranges from 75% to 90%. Deletion
of 13q is associated with specific clinicopathologic features, including
60
Number of primary tumors 40 0
20
20
40
60 Kappa IgH Lambda
1 2 3 4 5 6 7 8 9 10 11 12 131415 16 17 18 19 2021 22X
Fig. 56.52 CYTOGENOMIC PROFILES IN MULTIPLE MYELOMA. Summary of genomic profiles and
recurrence of chromosomal alterations in primary tumors demonstrated by array comparative genomic
hybridization. The recurrence plot mirrors the frequencies of previously reported chromosomal gains and
losses, including the deletions of 1p and amplifications of 1q. Integer-value recurrence of copy number
aberrations across the samples in segmented data is plotted on the y-axis. The x-axis is in chromosomal order.
Dark red or green bands denote the number of samples with gain or loss of chromosome material, and bright
red or green bars represent the number of samples showing amplification or deletion. Black dots show focal
deletions of the kappa (2p12), IgH (14q32), and lambda (22q11) loci physiologic in B-cell postgerminal center
neoplasms. (Reprinted with permission from Carasco DR, Tonon G, Huang Y, et al: High resolution genomic profiles
define distinct clinic pathogenic subgroups of multiple myeloma patients. Cancer Cell 4:313, 2006.)