
Page 30 - 9780077418427.pdf
P. 30
/Users/user-f465/Desktop
tiL12214_ch01_001-024.indd Page 7 9/1/10 9:51 PM user-f465
tiL12214_ch01_001-024.indd Page 7 9/1/10 9:51 PM user-f465 /Users/user-f465/Desktop
1.6 UNDERSTANDINGS FROM
MEASUREMENTS
One of the more basic uses of measurement is to describe 1 centimeter
something in an exact way that everyone can understand. For
example, if a friend in another city tells you that the weather
has been “warm,” you might not understand what temperature 2 centimeters
is being described. A statement that the air temperature is 70°F
carries more exact information than a statement about “warm 3 centimeters
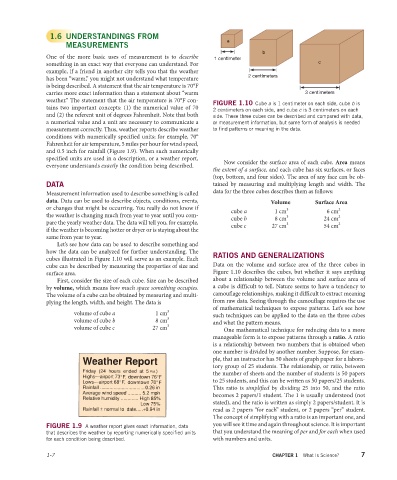
weather.” The statement that the air temperature is 70°F con- FIGURE 1.10 Cube a is 1 centimeter on each side, cube b is
tains two important concepts: (1) the numerical value of 70 2 centimeters on each side, and cube c is 3 centimeters on each
and (2) the referent unit of degrees Fahrenheit. Note that both side. These three cubes can be described and compared with data,
a numerical value and a unit are necessary to communicate a or measurement information, but some form of analysis is needed
measurement correctly. Thus, weather reports describe weather to find patterns or meaning in the data.
conditions with numerically specified units; for example, 70°
Fahrenheit for air temperature, 5 miles per hour for wind speed,
and 0.5 inch for rainfall (Figure 1.9). When such numerically
specified units are used in a description, or a weather report,
everyone understands exactly the condition being described. Now consider the surface area of each cube. Area means
the extent of a surface, and each cube has six surfaces, or faces
(top, bottom, and four sides). The area of any face can be ob-
DATA tained by measuring and multiplying length and width. The
Measurement information used to describe something is called data for the three cubes describes them as follows:
data. Data can be used to describe objects, conditions, events, Volume Surface Area
or changes that might be occurring. You really do not know if cube a 1 cm 3 6 cm 2
the weather is changing much from year to year until you com- cube b 8 cm 3 24 cm 2
pare the yearly weather data. The data will tell you, for example, cube c 27 cm 3 54 cm 2
if the weather is becoming hotter or dryer or is staying about the
same from year to year.
Let’s see how data can be used to describe something and
how the data can be analyzed for further understanding. The RATIOS AND GENERALIZATIONS
cubes illustrated in Figure 1.10 will serve as an example. Each
cube can be described by measuring the properties of size and Data on the volume and surface area of the three cubes in
surface area. Figure 1.10 describes the cubes, but whether it says anything
First, consider the size of each cube. Size can be described about a relationship between the volume and surface area of
by volume, which means how much space something occupies. a cube is difficult to tell. Nature seems to have a tendency to
The volume of a cube can be obtained by measuring and multi- camouflage relationships, making it difficult to extract meaning
plying the length, width, and height. The data is from raw data. Seeing through the camouflage requires the use
of mathematical techniques to expose patterns. Let’s see how
volume of cube a 1 cm 3 such techniques can be applied to the data on the three cubes
volume of cube b 8 cm 3 and what the pattern means.
volume of cube c 27 cm 3 One mathematical technique for reducing data to a more
manageable form is to expose patterns through a ratio. A ratio
is a relationship between two numbers that is obtained when
one number is divided by another number. Suppose, for exam-
ple, that an instructor has 50 sheets of graph paper for a labora-
tory group of 25 students. The relationship, or ratio, between
the number of sheets and the number of students is 50 papers
to 25 students, and this can be written as 50 papers/25 students.
This ratio is simplifi ed by dividing 25 into 50, and the ratio
becomes 2 papers/1 student. The 1 is usually understood (not
stated), and the ratio is written as simply 2 papers/student. It is
read as 2 papers “for each” student, or 2 papers “per” student.
The concept of simplifying with a ratio is an important one, and
you will see it time and again throughout science. It is important
FIGURE 1.9 A weather report gives exact information, data
that describes the weather by reporting numerically specified units that you understand the meaning of per and for each when used
for each condition being described. with numbers and units.
1-7 CHAPTER 1 What Is Science? 7