
Page 439 - 9780077418427.pdf
P. 439
/Users/user-f465/Desktop
tiL12214_ch16_405-432.indd Page 416 9/3/10 6:19 PM user-f465
tiL12214_ch16_405-432.indd Page 416 9/3/10 6:19 PM user-f465 /Users/user-f465/Desktop
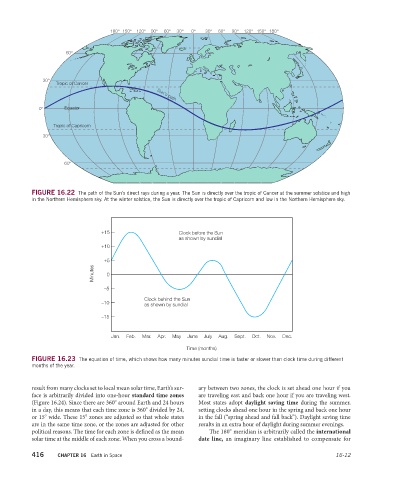
FIGURE 16.22 The path of the Sun’s direct rays during a year. The Sun is directly over the tropic of Cancer at the summer solstice and high
in the Northern Hemisphere sky. At the winter solstice, the Sun is directly over the tropic of Capricorn and low in the Northern Hemisphere sky.
+15 Clock before the Sun
as shown by sundial
+10
+5
Minutes 0
–5
Clock behind the Sun
–10 as shown by sundial
–15
Jan. Feb. Mar. Apr. May June July Aug. Sept. Oct. Nov. Dec.
Time (months)
FIGURE 16.23 The equation of time, which shows how many minutes sundial time is faster or slower than clock time during different
months of the year.
result from many clocks set to local mean solar time, Earth’s sur- ary between two zones, the clock is set ahead one hour if you
face is arbitrarily divided into one-hour standard time zones are traveling east and back one hour if you are traveling west.
(Figure 16.24). Since there are 360° around Earth and 24 hours Most states adopt daylight saving time during the summer,
in a day, this means that each time zone is 360° divided by 24, setting clocks ahead one hour in the spring and back one hour
or 15° wide. These 15° zones are adjusted so that whole states in the fall (“spring ahead and fall back”). Daylight saving time
are in the same time zone, or the zones are adjusted for other results in an extra hour of daylight during summer evenings.
political reasons. The time for each zone is defined as the mean The 180° meridian is arbitrarily called the international
solar time at the middle of each zone. When you cross a bound- date line, an imaginary line established to compensate for
416 CHAPTER 16 Earth in Space 16-12