Page 115 - Applied Statistics with R
P. 115

7.5. MAXIMUM LIKELIHOOD ESTIMATION (MLE) APPROACH                 115


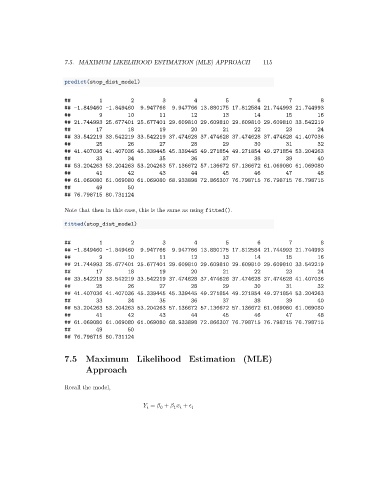
                      predict(stop_dist_model)


                      ##          1         2          3         4          5         6          7         8
                      ## -1.849460 -1.849460   9.947766   9.947766 13.880175 17.812584 21.744993 21.744993
                      ##          9        10         11        12         13        14         15        16
                      ## 21.744993 25.677401 25.677401 29.609810 29.609810 29.609810 29.609810 33.542219
                      ##         17        18         19        20         21        22         23        24
                      ## 33.542219 33.542219 33.542219 37.474628 37.474628 37.474628 37.474628 41.407036
                      ##         25        26         27        28         29        30         31        32
                      ## 41.407036 41.407036 45.339445 45.339445 49.271854 49.271854 49.271854 53.204263
                      ##         33        34         35        36         37        38         39        40
                      ## 53.204263 53.204263 53.204263 57.136672 57.136672 57.136672 61.069080 61.069080
                      ##         41        42         43        44         45        46         47        48
                      ## 61.069080 61.069080 61.069080 68.933898 72.866307 76.798715 76.798715 76.798715
                      ##         49        50
                      ## 76.798715 80.731124

                      Note that then in this case, this is the same as using fitted().

                      fitted(stop_dist_model)

                      ##          1         2          3         4          5         6          7         8
                      ## -1.849460 -1.849460   9.947766   9.947766 13.880175 17.812584 21.744993 21.744993
                      ##          9        10         11        12         13        14         15        16
                      ## 21.744993 25.677401 25.677401 29.609810 29.609810 29.609810 29.609810 33.542219
                      ##         17        18         19        20         21        22         23        24
                      ## 33.542219 33.542219 33.542219 37.474628 37.474628 37.474628 37.474628 41.407036
                      ##         25        26         27        28         29        30         31        32
                      ## 41.407036 41.407036 45.339445 45.339445 49.271854 49.271854 49.271854 53.204263
                      ##         33        34         35        36         37        38         39        40
                      ## 53.204263 53.204263 53.204263 57.136672 57.136672 57.136672 61.069080 61.069080
                      ##         41        42         43        44         45        46         47        48
                      ## 61.069080 61.069080 61.069080 68.933898 72.866307 76.798715 76.798715 76.798715
                      ##         49        50
                      ## 76.798715 80.731124


                      7.5 Maximum Likelihood Estimation (MLE)
                             Approach


                      Recall the model,


                                                   =    +       +      
                                                          1   
                                                      0
                                                    
   110   111   112   113   114   115   116   117   118   119   120