
Page 164 - Applied Statistics with R
P. 164
164 CHAPTER 9. MULTIPLE LINEAR REGRESSION
̂
̂
− − 0
= = ,
̂
SE[ ] √
which, under the null hypothesis, follows a distribution with − degrees of
freedom.
Recall our model for mpg,
= + + + , = 1, 2, … ,
2 2
0
1 1
2
where ∼ (0, ).
• 1 as the weight (wt) of the th car.
• 2 as the model year (year) of the th car.
Then the test
∶ = 0 vs ∶ ≠ 0
1
0
1
1
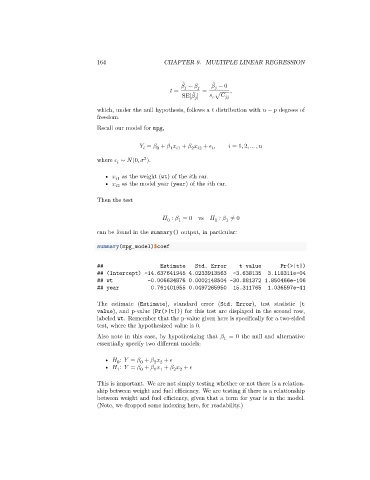
can be found in the summary() output, in particular:
summary(mpg_model)$coef
## Estimate Std. Error t value Pr(>|t|)
## (Intercept) -14.637641945 4.0233913563 -3.638135 3.118311e-04
## wt -0.006634876 0.0002148504 -30.881372 1.850466e-106
## year 0.761401955 0.0497265950 15.311765 1.036597e-41
The estimate (Estimate), standard error (Std. Error), test statistic (t
value), and p-value (Pr(>|t|)) for this test are displayed in the second row,
labeled wt. Remember that the p-value given here is specifically for a two-sided
test, where the hypothesized value is 0.
Also note in this case, by hypothesizing that = 0 the null and alternative
1
essentially specify two different models:
• : = + +
0
2 2
0
• : = + + +
0
1
2 2
1 1
This is important. We are not simply testing whether or not there is a relation-
ship between weight and fuel efficiency. We are testing if there is a relationship
between weight and fuel efficiency, given that a term for year is in the model.
(Note, we dropped some indexing here, for readability.)