
Page 269 - Applied Statistics with R
P. 269
13.2. CHECKING ASSUMPTIONS 269
Data from Model 3
120
80
y
60
40
20
0
0 1 2 3 4 5
x
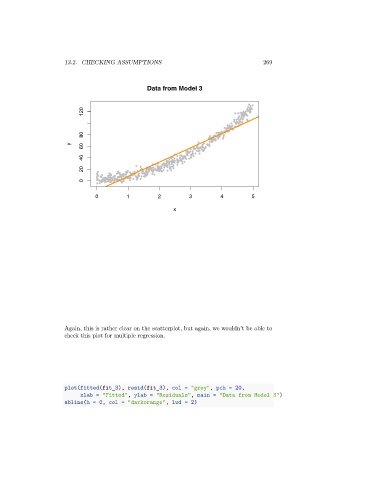
Again, this is rather clear on the scatterplot, but again, we wouldn’t be able to
check this plot for multiple regression.
plot(fitted(fit_3), resid(fit_3), col = "grey", pch = 20,
xlab = "Fitted", ylab = "Residuals", main = "Data from Model 3")
abline(h = 0, col = "darkorange", lwd = 2)