
Page 270 - Applied Statistics with R
P. 270
270 CHAPTER 13. MODEL DIAGNOSTICS
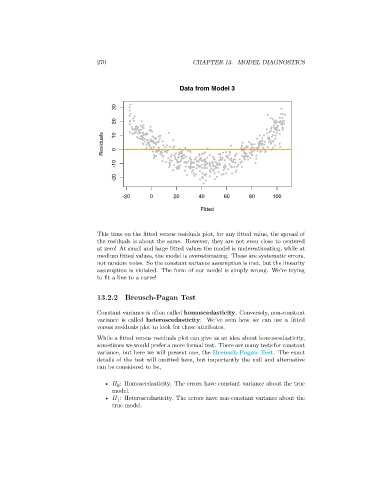
Data from Model 3
30
20
Residuals 10 0
-10
-20
-20 0 20 40 60 80 100
Fitted
This time on the fitted versus residuals plot, for any fitted value, the spread of
the residuals is about the same. However, they are not even close to centered
at zero! At small and large fitted values the model is underestimating, while at
medium fitted values, the model is overestimating. These are systematic errors,
not random noise. So the constant variance assumption is met, but the linearity
assumption is violated. The form of our model is simply wrong. We’re trying
to fit a line to a curve!
13.2.2 Breusch-Pagan Test
Constant variance is often called homoscedasticity. Conversely, non-constant
variance is called heteroscedasticity. We’ve seen how we can use a fitted
versus residuals plot to look for these attributes.
While a fitted versus residuals plot can give us an idea about homoscedasticity,
sometimes we would prefer a more formal test. There are many tests for constant
variance, but here we will present one, the Breusch-Pagan Test. The exact
details of the test will omitted here, but importantly the null and alternative
can be considered to be,
• : Homoscedasticity. The errors have constant variance about the true
0
model.
• : Heteroscedasticity. The errors have non-constant variance about the
1
true model.