
Page 328 - Applied Statistics with R
P. 328
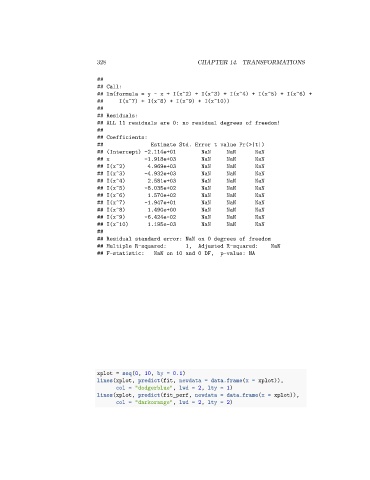
328                              CHAPTER 14. TRANSFORMATIONS


                                 ##
                                 ## Call:
                                 ## lm(formula = y ~ x + I(x^2) + I(x^3) + I(x^4) + I(x^5) + I(x^6) +
                                 ##     I(x^7) + I(x^8) + I(x^9) + I(x^10))
                                 ##
                                 ## Residuals:
                                 ## ALL 11 residuals are 0: no residual degrees of freedom!
                                 ##
                                 ## Coefficients:
                                 ##                Estimate Std. Error t value Pr(>|t|)
                                 ## (Intercept) -2.114e+01          NaN     NaN      NaN
                                 ## x            -1.918e+03         NaN     NaN      NaN
                                 ## I(x^2)        4.969e+03         NaN     NaN      NaN
                                 ## I(x^3)       -4.932e+03         NaN     NaN      NaN
                                 ## I(x^4)        2.581e+03         NaN     NaN      NaN
                                 ## I(x^5)       -8.035e+02         NaN     NaN      NaN
                                 ## I(x^6)        1.570e+02         NaN     NaN      NaN
                                 ## I(x^7)       -1.947e+01         NaN     NaN      NaN
                                 ## I(x^8)        1.490e+00         NaN     NaN      NaN
                                 ## I(x^9)       -6.424e-02         NaN     NaN      NaN
                                 ## I(x^10)       1.195e-03         NaN     NaN      NaN
                                 ##
                                 ## Residual standard error: NaN on 0 degrees of freedom
                                 ## Multiple R-squared:       1,   Adjusted R-squared:     NaN
                                 ## F-statistic:    NaN on 10 and 0 DF,   p-value: NA


                                 xplot = seq(0, 10, by = 0.1)
                                 lines(xplot, predict(fit, newdata = data.frame(x = xplot)),
                                       col = "dodgerblue", lwd = 2, lty = 1)
                                 lines(xplot, predict(fit_perf, newdata = data.frame(x = xplot)),
                                       col = "darkorange", lwd = 2, lty = 2)