
Page 376 - Applied Statistics with R
P. 376
376 CHAPTER 15. COLLINEARITY
60 40
Residuals, Original Model 20 0 -40
-80
-1.5 -1.0 -0.5 0.0 0.5 1.0 1.5
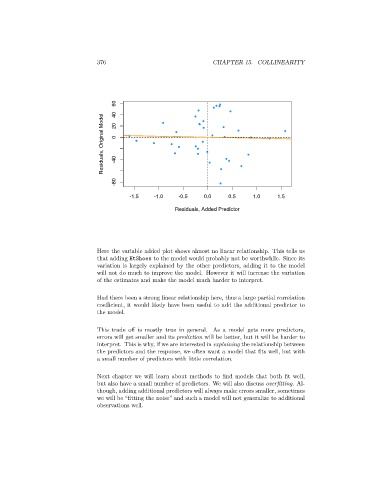
Residuals, Added Predictor
Here the variable added plot shows almost no linear relationship. This tells us
that adding HtShoes to the model would probably not be worthwhile. Since its
variation is largely explained by the other predictors, adding it to the model
will not do much to improve the model. However it will increase the variation
of the estimates and make the model much harder to interpret.
Had there been a strong linear relationship here, thus a large partial correlation
coefficient, it would likely have been useful to add the additional predictor to
the model.
This trade off is mostly true in general. As a model gets more predictors,
errors will get smaller and its prediction will be better, but it will be harder to
interpret. This is why, if we are interested in explaining the relationship between
the predictors and the response, we often want a model that fits well, but with
a small number of predictors with little correlation.
Next chapter we will learn about methods to find models that both fit well,
but also have a small number of predictors. We will also discuss overfitting. Al-
though, adding additional predictors will always make errors smaller, sometimes
we will be “fitting the noise” and such a model will not generalize to additional
observations well.