
Page 225 - Python Data Science Handbook
P. 225
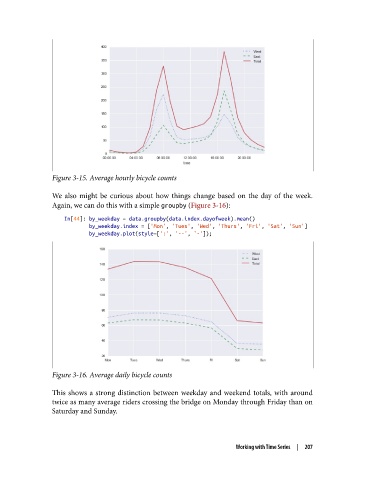
Figure 3-15. Average hourly bicycle counts

               We also might be curious about how things change based on the day of the week.
               Again, we can do this with a simple groupby (Figure 3-16):

                   In[44]: by_weekday = data.groupby(data.index.dayofweek).mean()
                           by_weekday.index = ['Mon', 'Tues', 'Wed', 'Thurs', 'Fri', 'Sat', 'Sun']
                           by_weekday.plot(style=[':', '--', '-']);


               Figure 3-16. Average daily bicycle counts

               This shows a strong distinction between weekday and weekend totals, with around
               twice as many average riders crossing the bridge on Monday through Friday than on
               Saturday and Sunday.


                                                                  Working with Time Series  |  207