
Page 255 - Python Data Science Handbook
P. 255
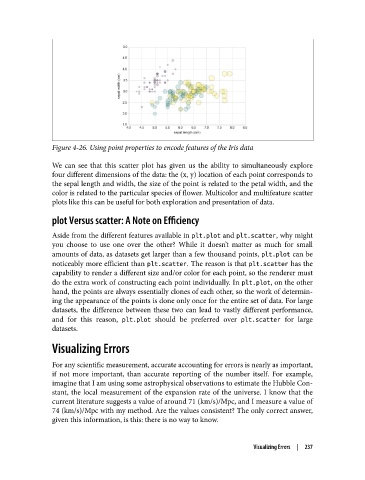
Figure 4-26. Using point properties to encode features of the Iris data


               We can see that this scatter plot has given us the ability to simultaneously explore
               four different dimensions of the data: the (x, y) location of each point corresponds to
               the sepal length and width, the size of the point is related to the petal width, and the
               color is related to the particular species of flower. Multicolor and multifeature scatter
               plots like this can be useful for both exploration and presentation of data.

               plot Versus scatter: A Note on Efficiency

               Aside from the different features available in plt.plot and plt.scatter, why might
               you choose to use one over the other? While it doesn’t matter as much for small
               amounts of data, as datasets get larger than a few thousand points, plt.plot can be
               noticeably more efficient than plt.scatter. The reason is that plt.scatter has the
               capability to render a different size and/or color for each point, so the renderer must
               do the extra work of constructing each point individually. In plt.plot, on the other
               hand, the points are always essentially clones of each other, so the work of determin‐
               ing the appearance of the points is done only once for the entire set of data. For large
               datasets, the difference between these two can lead to vastly different performance,
               and for this reason, plt.plot  should be preferred over plt.scatter  for large
               datasets.
               Visualizing Errors


               For any scientific measurement, accurate accounting for errors is nearly as important,
               if not more important, than accurate reporting of the number itself. For example,
               imagine that I am using some astrophysical observations to estimate the Hubble Con‐
               stant, the local measurement of the expansion rate of the universe. I know that the
               current literature suggests a value of around 71 (km/s)/Mpc, and I measure a value of
               74 (km/s)/Mpc with my method. Are the values consistent? The only correct answer,
               given this information, is this: there is no way to know.


                                                                       Visualizing Errors  |  237