
Page 252 - Python Data Science Handbook
P. 252
plt.legend(numpoints=1)
plt.xlim(0, 1.8);
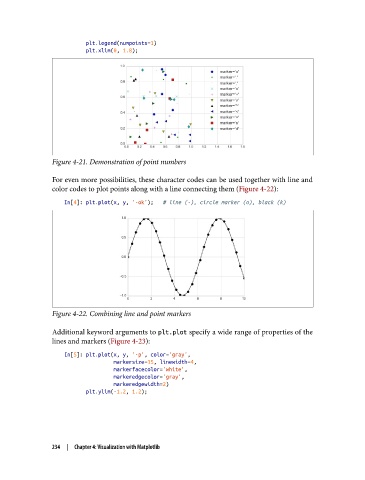
Figure 4-21. Demonstration of point numbers
For even more possibilities, these character codes can be used together with line and
color codes to plot points along with a line connecting them (Figure 4-22):
In[4]: plt.plot(x, y, '-ok'); # line (-), circle marker (o), black (k)
Figure 4-22. Combining line and point markers
Additional keyword arguments to plt.plot specify a wide range of properties of the
lines and markers (Figure 4-23):
In[5]: plt.plot(x, y, '-p', color='gray',
markersize=15, linewidth=4,
markerfacecolor='white',
markeredgecolor='gray',
markeredgewidth=2)
plt.ylim(-1.2, 1.2);
234 | Chapter 4: Visualization with Matplotlib