
Page 250 - Python Data Science Handbook
P. 250
As you can see, the plt.legend() function keeps track of the line style and color, and
matches these with the correct label. More information on specifying and formatting
plot legends can be found in the plt.legend() docstring; additionally, we will cover
some more advanced legend options in “Customizing Plot Legends” on page 249.
Matplotlib Gotchas
While most plt functions translate directly to ax methods (such as plt.plot() →
ax.plot(), plt.legend() → ax.legend(), etc.), this is not the case for all com‐
mands. In particular, functions to set limits, labels, and titles are slightly modified.
For transitioning between MATLAB-style functions and object-oriented methods,
make the following changes:
• plt.xlabel() → ax.set_xlabel()
• plt.ylabel() → ax.set_ylabel()
• plt.xlim() → ax.set_xlim()
• plt.ylim() → ax.set_ylim()
• plt.title() → ax.set_title()
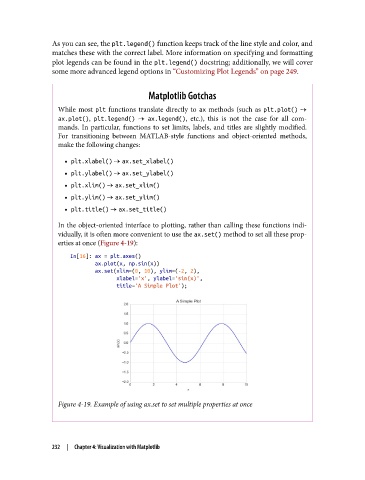
In the object-oriented interface to plotting, rather than calling these functions indi‐
vidually, it is often more convenient to use the ax.set() method to set all these prop‐
erties at once (Figure 4-19):
In[16]: ax = plt.axes()
ax.plot(x, np.sin(x))
ax.set(xlim=(0, 10), ylim=(-2, 2),
xlabel='x', ylabel='sin(x)',
title='A Simple Plot');
Figure 4-19. Example of using ax.set to set multiple properties at once
232 | Chapter 4: Visualization with Matplotlib