
Page 262 - Python Data Science Handbook
P. 262
• plt.imshow() will automatically adjust the axis aspect ratio to match the input
data; you can change this by setting, for example, plt.axis(aspect='image') to
make x and y units match.
Figure 4-33. Representing three-dimensional data as an image
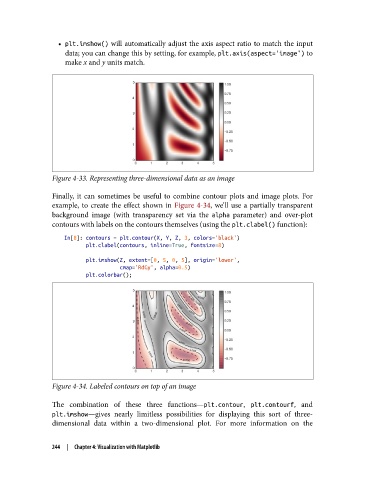
Finally, it can sometimes be useful to combine contour plots and image plots. For
example, to create the effect shown in Figure 4-34, we’ll use a partially transparent
background image (with transparency set via the alpha parameter) and over-plot
contours with labels on the contours themselves (using the plt.clabel() function):
In[8]: contours = plt.contour(X, Y, Z, 3, colors='black')
plt.clabel(contours, inline=True, fontsize=8)
plt.imshow(Z, extent=[0, 5, 0, 5], origin='lower',
cmap='RdGy', alpha=0.5)
plt.colorbar();
Figure 4-34. Labeled contours on top of an image
The combination of these three functions—plt.contour, plt.contourf, and
plt.imshow—gives nearly limitless possibilities for displaying this sort of three-
dimensional data within a two-dimensional plot. For more information on the
244 | Chapter 4: Visualization with Matplotlib