
Page 264 - Python Data Science Handbook
P. 264
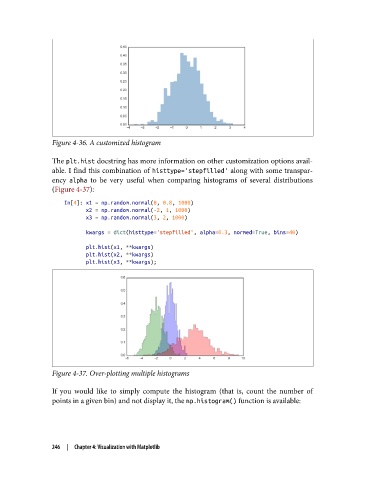
Figure 4-36. A customized histogram

               The plt.hist docstring has more information on other customization options avail‐
               able. I find this combination of histtype='stepfilled'  along with some transpar‐
               ency alpha  to be very useful when comparing histograms of several distributions
               (Figure 4-37):
                   In[4]: x1 = np.random.normal(0, 0.8, 1000)
                          x2 = np.random.normal(-2, 1, 1000)
                          x3 = np.random.normal(3, 2, 1000)

                          kwargs = dict(histtype='stepfilled', alpha=0.3, normed=True, bins=40)
                          plt.hist(x1, **kwargs)
                          plt.hist(x2, **kwargs)
                          plt.hist(x3, **kwargs);


               Figure 4-37. Over-plotting multiple histograms

               If you would like to simply compute the histogram (that is, count the number of
               points in a given bin) and not display it, the np.histogram() function is available:


               246  |  Chapter 4: Visualization with Matplotlib