
Page 263 - Python Data Science Handbook
P. 263
options available in these functions, refer to their docstrings. If you are interested in
three-dimensional visualizations of this type of data, see “Three-Dimensional Plot‐
ting in Matplotlib” on page 290.
Histograms, Binnings, and Density
A simple histogram can be a great first step in understanding a dataset. Earlier, we
saw a preview of Matplotlib’s histogram function (see “Comparisons, Masks, and
Boolean Logic” on page 70), which creates a basic histogram in one line, once the
normal boilerplate imports are done (Figure 4-35):
In[1]: %matplotlib inline
import numpy as np
import matplotlib.pyplot as plt
plt.style.use('seaborn-white')
data = np.random.randn(1000)
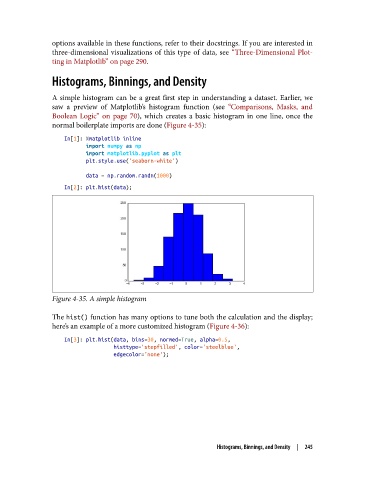
In[2]: plt.hist(data);
Figure 4-35. A simple histogram
The hist() function has many options to tune both the calculation and the display;
here’s an example of a more customized histogram (Figure 4-36):
In[3]: plt.hist(data, bins=30, normed=True, alpha=0.5,
histtype='stepfilled', color='steelblue',
edgecolor='none');
Histograms, Binnings, and Density | 245