
Page 265 - Python Data Science Handbook
P. 265
In[5]: counts, bin_edges = np.histogram(data, bins=5)
print(counts)
[ 12 190 468 301 29]
Two-Dimensional Histograms and Binnings
Just as we create histograms in one dimension by dividing the number line into bins,
we can also create histograms in two dimensions by dividing points among two-
dimensional bins. We’ll take a brief look at several ways to do this here. We’ll start by
defining some data—an x and y array drawn from a multivariate Gaussian
distribution:
In[6]: mean = [0, 0]
cov = [[1, 1], [1, 2]]
x, y = np.random.multivariate_normal(mean, cov, 10000).T
plt.hist2d: Two-dimensional histogram
One straightforward way to plot a two-dimensional histogram is to use Matplotlib’s
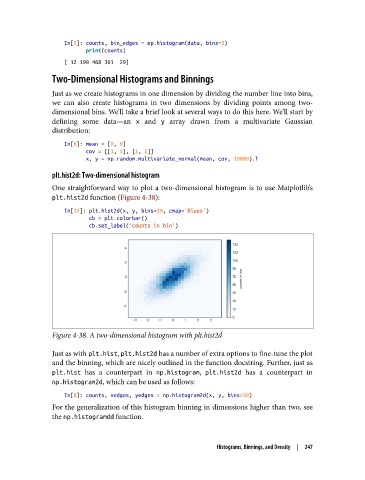
plt.hist2d function (Figure 4-38):
In[12]: plt.hist2d(x, y, bins=30, cmap='Blues')
cb = plt.colorbar()
cb.set_label('counts in bin')
Figure 4-38. A two-dimensional histogram with plt.hist2d
Just as with plt.hist, plt.hist2d has a number of extra options to fine-tune the plot
and the binning, which are nicely outlined in the function docstring. Further, just as
plt.hist has a counterpart in np.histogram, plt.hist2d has a counterpart in
np.histogram2d, which can be used as follows:
In[8]: counts, xedges, yedges = np.histogram2d(x, y, bins=30)
For the generalization of this histogram binning in dimensions higher than two, see
the np.histogramdd function.
Histograms, Binnings, and Density | 247