
Page 269 - Python Data Science Handbook
P. 269
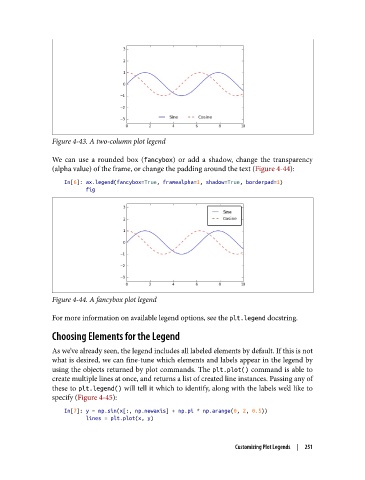
Figure 4-43. A two-column plot legend


               We can use a rounded box (fancybox) or add a shadow, change the transparency
               (alpha value) of the frame, or change the padding around the text (Figure 4-44):

                   In[6]: ax.legend(fancybox=True, framealpha=1, shadow=True, borderpad=1)
                          fig


               Figure 4-44. A fancybox plot legend

               For more information on available legend options, see the plt.legend docstring.

               Choosing Elements for the Legend

               As we’ve already seen, the legend includes all labeled elements by default. If this is not
               what is desired, we can fine-tune which elements and labels appear in the legend by
               using the objects returned by plot commands. The plt.plot() command is able to
               create multiple lines at once, and returns a list of created line instances. Passing any of
               these to plt.legend() will tell it which to identify, along with the labels we’d like to
               specify (Figure 4-45):
                   In[7]: y = np.sin(x[:, np.newaxis] + np.pi * np.arange(0, 2, 0.5))
                          lines = plt.plot(x, y)


                                                                  Customizing Plot Legends  |  251