
Page 383 - Python Data Science Handbook
P. 383
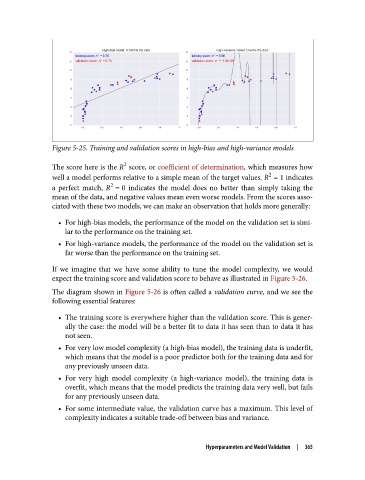
Figure 5-25. Training and validation scores in high-bias and high-variance models

                                   2
               The score here is the R  score, or coefficient of determination, which measures how
                                                                           2
               well a model performs relative to a simple mean of the target values. R = 1 indicates
                                2
               a perfect match, R = 0  indicates the model does no better than simply taking the
               mean of the data, and negative values mean even worse models. From the scores asso‐
               ciated with these two models, we can make an observation that holds more generally:
                 • For high-bias models, the performance of the model on the validation set is simi‐
                   lar to the performance on the training set.
                 • For high-variance models, the performance of the model on the validation set is
                   far worse than the performance on the training set.

               If we imagine that we have some ability to tune the model complexity, we would
               expect the training score and validation score to behave as illustrated in Figure 5-26.
               The diagram shown in Figure 5-26 is often called a validation curve, and we see the
               following essential features:

                 • The training score is everywhere higher than the validation score. This is gener‐
                   ally the case: the model will be a better fit to data it has seen than to data it has
                   not seen.
                 • For very low model complexity (a high-bias model), the training data is underfit,
                   which means that the model is a poor predictor both for the training data and for
                   any previously unseen data.
                 • For very high model complexity (a high-variance model), the training data is
                   overfit, which means that the model predicts the training data very well, but fails
                   for any previously unseen data.

                 • For some intermediate value, the validation curve has a maximum. This level of
                   complexity indicates a suitable trade-off between bias and variance.


                                                          Hyperparameters and Model Validation  |  365