
Page 387 - Python Data Science Handbook
P. 387
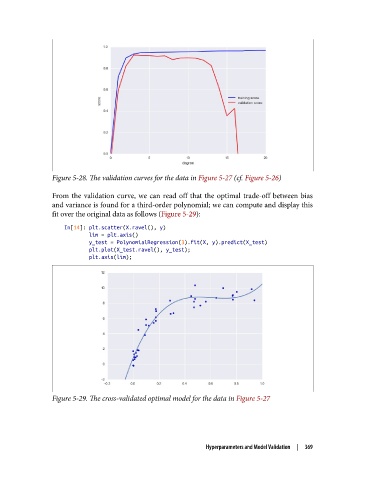
Figure 5-28. The validation curves for the data in Figure 5-27 (cf. Figure 5-26)

               From the validation curve, we can read off that the optimal trade-off between bias
               and variance is found for a third-order polynomial; we can compute and display this
               fit over the original data as follows (Figure 5-29):

                   In[14]: plt.scatter(X.ravel(), y)
                           lim = plt.axis()
                           y_test = PolynomialRegression(3).fit(X, y).predict(X_test)
                           plt.plot(X_test.ravel(), y_test);
                           plt.axis(lim);


               Figure 5-29. The cross-validated optimal model for the data in Figure 5-27


                                                          Hyperparameters and Model Validation  |  369