
Page 389 - Python Data Science Handbook
P. 389
plt.xlabel('degree')
plt.ylabel('score');
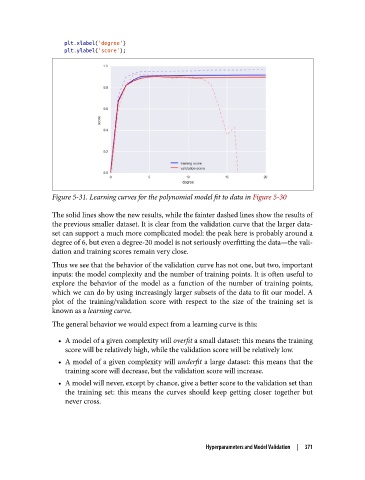
Figure 5-31. Learning curves for the polynomial model fit to data in Figure 5-30
The solid lines show the new results, while the fainter dashed lines show the results of
the previous smaller dataset. It is clear from the validation curve that the larger data‐
set can support a much more complicated model: the peak here is probably around a
degree of 6, but even a degree-20 model is not seriously overfitting the data—the vali‐
dation and training scores remain very close.
Thus we see that the behavior of the validation curve has not one, but two, important
inputs: the model complexity and the number of training points. It is often useful to
explore the behavior of the model as a function of the number of training points,
which we can do by using increasingly larger subsets of the data to fit our model. A
plot of the training/validation score with respect to the size of the training set is
known as a learning curve.
The general behavior we would expect from a learning curve is this:
• A model of a given complexity will overfit a small dataset: this means the training
score will be relatively high, while the validation score will be relatively low.
• A model of a given complexity will underfit a large dataset: this means that the
training score will decrease, but the validation score will increase.
• A model will never, except by chance, give a better score to the validation set than
the training set: this means the curves should keep getting closer together but
never cross.
Hyperparameters and Model Validation | 371