
Page 433 - Python Data Science Handbook
P. 433
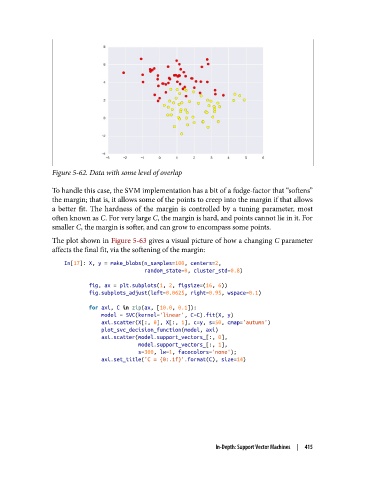
Figure 5-62. Data with some level of overlap

               To handle this case, the SVM implementation has a bit of a fudge-factor that “softens”
               the margin; that is, it allows some of the points to creep into the margin if that allows
               a better fit. The hardness of the margin is controlled by a tuning parameter, most
               often known as C. For very large C, the margin is hard, and points cannot lie in it. For
               smaller C, the margin is softer, and can grow to encompass some points.
               The plot shown in Figure 5-63 gives a visual picture of how a changing C parameter
               affects the final fit, via the softening of the margin:

                   In[17]: X, y = make_blobs(n_samples=100, centers=2,
                                             random_state=0, cluster_std=0.8)

                           fig, ax = plt.subplots(1, 2, figsize=(16, 6))
                           fig.subplots_adjust(left=0.0625, right=0.95, wspace=0.1)
                           for axi, C in zip(ax, [10.0, 0.1]):
                               model = SVC(kernel='linear', C=C).fit(X, y)
                               axi.scatter(X[:, 0], X[:, 1], c=y, s=50, cmap='autumn')
                               plot_svc_decision_function(model, axi)
                               axi.scatter(model.support_vectors_[:, 0],
                                           model.support_vectors_[:, 1],
                                           s=300, lw=1, facecolors='none');
                               axi.set_title('C = {0:.1f}'.format(C), size=14)


                                                             In-Depth: Support Vector Machines  |  415