
Page 437 - Python Data Science Handbook
P. 437
In[25]: from sklearn.metrics import classification_report
print(classification_report(ytest, yfit,
target_names=faces.target_names))
precision recall f1-score support
Ariel Sharon 0.65 0.73 0.69 15
Colin Powell 0.81 0.87 0.84 68
Donald Rumsfeld 0.75 0.87 0.81 31
George W Bush 0.93 0.83 0.88 126
Gerhard Schroeder 0.86 0.78 0.82 23
Hugo Chavez 0.93 0.70 0.80 20
Junichiro Koizumi 0.80 1.00 0.89 12
Tony Blair 0.83 0.93 0.88 42
avg / total 0.85 0.85 0.85 337
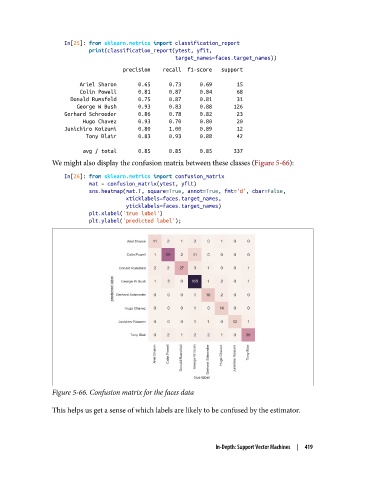
We might also display the confusion matrix between these classes (Figure 5-66):
In[26]: from sklearn.metrics import confusion_matrix
mat = confusion_matrix(ytest, yfit)
sns.heatmap(mat.T, square=True, annot=True, fmt='d', cbar=False,
xticklabels=faces.target_names,
yticklabels=faces.target_names)
plt.xlabel('true label')
plt.ylabel('predicted label');
Figure 5-66. Confusion matrix for the faces data
This helps us get a sense of which labels are likely to be confused by the estimator.
In-Depth: Support Vector Machines | 419