
Page 442 - Python Data Science Handbook
P. 442
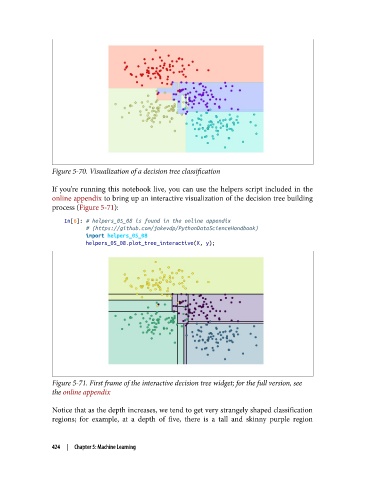
Figure 5-70. Visualization of a decision tree classification

               If you’re running this notebook live, you can use the helpers script included in the
               online appendix to bring up an interactive visualization of the decision tree building
               process (Figure 5-71):

                   In[6]: # helpers_05_08 is found in the online appendix
                          # (https://github.com/jakevdp/PythonDataScienceHandbook)
                          import helpers_05_08
                          helpers_05_08.plot_tree_interactive(X, y);


               Figure 5-71. First frame of the interactive decision tree widget; for the full version, see
               the online appendix

               Notice that as the depth increases, we tend to get very strangely shaped classification
               regions; for example, at a depth of five, there is a tall and skinny purple region


               424  |  Chapter 5: Machine Learning