
Page 447 - Python Data Science Handbook
P. 447
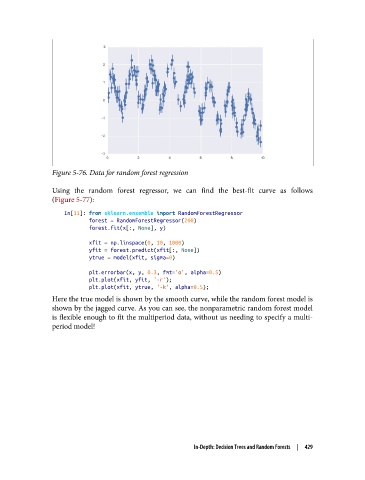
Figure 5-76. Data for random forest regression

               Using the random forest regressor, we can find the best-fit curve as follows
               (Figure 5-77):
                   In[11]: from sklearn.ensemble import RandomForestRegressor
                           forest = RandomForestRegressor(200)
                           forest.fit(x[:, None], y)
                           xfit = np.linspace(0, 10, 1000)
                           yfit = forest.predict(xfit[:, None])
                           ytrue = model(xfit, sigma=0)
                           plt.errorbar(x, y, 0.3, fmt='o', alpha=0.5)
                           plt.plot(xfit, yfit, '-r');
                           plt.plot(xfit, ytrue, '-k', alpha=0.5);
               Here the true model is shown by the smooth curve, while the random forest model is
               shown by the jagged curve. As you can see, the nonparametric random forest model
               is flexible enough to fit the multiperiod data, without us needing to specify a multi‐
               period model!


                                                       In-Depth: Decision Trees and Random Forests  |  429