
Page 443 - Python Data Science Handbook
P. 443
between the yellow and blue regions. It’s clear that this is less a result of the true,
intrinsic data distribution, and more a result of the particular sampling or noise prop‐
erties of the data. That is, this decision tree, even at only five levels deep, is clearly
overfitting our data.
Decision trees and overfitting
Such overfitting turns out to be a general property of decision trees; it is very easy to
go too deep in the tree, and thus to fit details of the particular data rather than the
overall properties of the distributions they are drawn from. Another way to see this
overfitting is to look at models trained on different subsets of the data—for example,
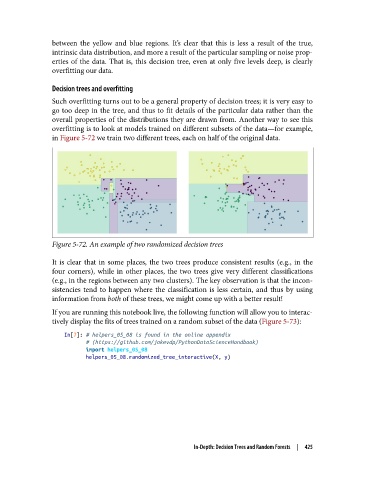
in Figure 5-72 we train two different trees, each on half of the original data.
Figure 5-72. An example of two randomized decision trees
It is clear that in some places, the two trees produce consistent results (e.g., in the
four corners), while in other places, the two trees give very different classifications
(e.g., in the regions between any two clusters). The key observation is that the incon‐
sistencies tend to happen where the classification is less certain, and thus by using
information from both of these trees, we might come up with a better result!
If you are running this notebook live, the following function will allow you to interac‐
tively display the fits of trees trained on a random subset of the data (Figure 5-73):
In[7]: # helpers_05_08 is found in the online appendix
# (https://github.com/jakevdp/PythonDataScienceHandbook)
import helpers_05_08
helpers_05_08.randomized_tree_interactive(X, y)
In-Depth: Decision Trees and Random Forests | 425