
Page 459 - Python Data Science Handbook
P. 459
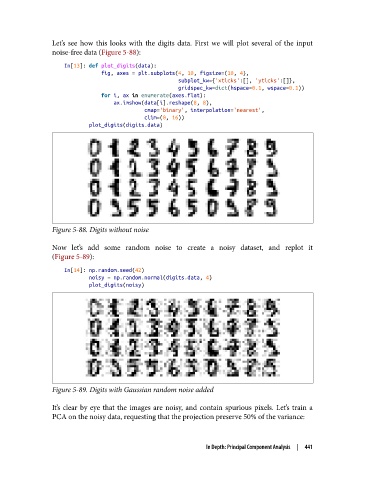
Let’s see how this looks with the digits data. First we will plot several of the input
               noise-free data (Figure 5-88):

                   In[13]: def plot_digits(data):
                               fig, axes = plt.subplots(4, 10, figsize=(10, 4),
                                                        subplot_kw={'xticks':[], 'yticks':[]},
                                                        gridspec_kw=dict(hspace=0.1, wspace=0.1))
                               for i, ax in enumerate(axes.flat):
                                   ax.imshow(data[i].reshape(8, 8),
                                             cmap='binary', interpolation='nearest',
                                             clim=(0, 16))
                           plot_digits(digits.data)


               Figure 5-88. Digits without noise

               Now let’s add some random noise to create a noisy dataset, and replot it
               (Figure 5-89):

                   In[14]: np.random.seed(42)
                           noisy = np.random.normal(digits.data, 4)
                           plot_digits(noisy)


               Figure 5-89. Digits with Gaussian random noise added

               It’s clear by eye that the images are noisy, and contain spurious pixels. Let’s train a
               PCA on the noisy data, requesting that the projection preserve 50% of the variance:


                                                          In Depth: Principal Component Analysis  |  441