
Page 456 - Python Data Science Handbook
P. 456
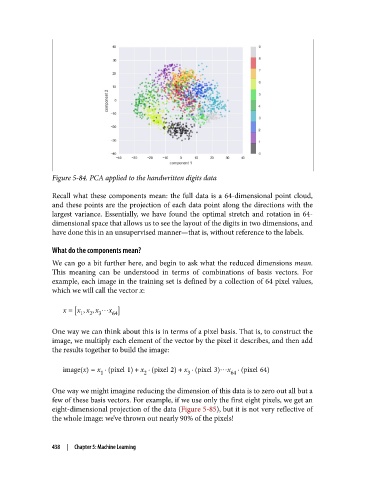
Figure 5-84. PCA applied to the handwritten digits data

               Recall what these components mean: the full data is a 64-dimensional point cloud,
               and these points are the projection of each data point along the directions with the
               largest variance. Essentially, we have found the optimal stretch and rotation in 64-
               dimensional space that allows us to see the layout of the digits in two dimensions, and
               have done this in an unsupervised manner—that is, without reference to the labels.

               What do the components mean?
               We can go a bit further here, and begin to ask what the reduced dimensions mean.
               This meaning can be understood in terms of combinations of basis vectors. For
               example, each image in the training set is defined by a collection of 64 pixel values,
               which we will call the vector x:


                  x = x , x , x ٵx 64
                          2
                       1
                            3
               One way we can think about this is in terms of a pixel basis. That is, to construct the
               image, we multiply each element of the vector by the pixel it describes, and then add
               the results together to build the image:


                  image x = x · pixel 1 + x · pixel 2 + x · pixel 3 ٵx · pixel 64
                             1
                                                                 64
                                                     3
                                         2
               One way we might imagine reducing the dimension of this data is to zero out all but a
               few of these basis vectors. For example, if we use only the first eight pixels, we get an
               eight-dimensional projection of the data (Figure 5-85), but it is not very reflective of
               the whole image: we’ve thrown out nearly 90% of the pixels!


               438  |  Chapter 5: Machine Learning