
Page 79 - Python Data Science Handbook
P. 79
first axis will be collapsed: for two-dimensional arrays, this means that values within
each column will be aggregated.
Other aggregation functions
NumPy provides many other aggregation functions, but we won’t discuss them in
detail here. Additionally, most aggregates have a NaN-safe counterpart that computes
the result while ignoring missing values, which are marked by the special IEEE
floating-point NaN value (for a fuller discussion of missing data, see “Handling Miss‐
ing Data” on page 119). Some of these NaN-safe functions were not added until
NumPy 1.8, so they will not be available in older NumPy versions.
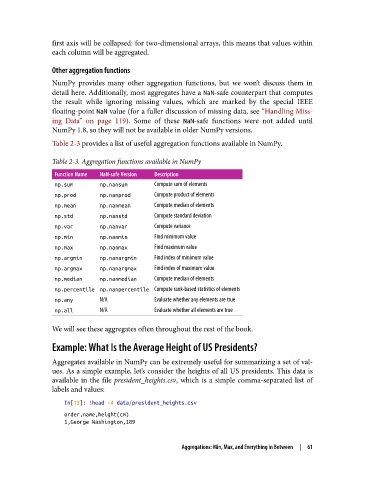
Table 2-3 provides a list of useful aggregation functions available in NumPy.
Table 2-3. Aggregation functions available in NumPy
Function Name NaN-safe Version Description
np.sum np.nansum Compute sum of elements
np.prod np.nanprod Compute product of elements
np.mean np.nanmean Compute median of elements
np.std np.nanstd Compute standard deviation
np.var np.nanvar Compute variance
np.min np.nanmin Find minimum value
np.max np.nanmax Find maximum value
np.argmin np.nanargmin Find index of minimum value
np.argmax np.nanargmax Find index of maximum value
np.median np.nanmedian Compute median of elements
np.percentile np.nanpercentile Compute rank-based statistics of elements
np.any N/A Evaluate whether any elements are true
np.all N/A Evaluate whether all elements are true
We will see these aggregates often throughout the rest of the book.
Example: What Is the Average Height of US Presidents?
Aggregates available in NumPy can be extremely useful for summarizing a set of val‐
ues. As a simple example, let’s consider the heights of all US presidents. This data is
available in the file president_heights.csv, which is a simple comma-separated list of
labels and values:
In[13]: !head -4 data/president_heights.csv
order,name,height(cm)
1,George Washington,189
Aggregations: Min, Max, and Everything in Between | 61