
Page 346 - Cardiac Nursing
P. 346
0:3
0:3
1
/09
1
0 P
Pa
Pa
M
0 P
M
q
xd
q
32.
q
xd
/29
/09
/29
6
6
a
ara
a
A
A
ara
p
p
p
t
t
e 3
e 3
g
g
g
c.
22
22
In
c.
In
32.
30
LWBK340-c15_
LWB
30
K34
p
p
0-c
0-3
15_
LWB K34 0-c 15_ pp300-332.qxd 6/29/09 10:30 PM Page 322 Aptara Inc.
0-3
322 P A R T III / Assessment of Heart Disease
R
I I I I a a a a a a a a a a a aV R R R R R R R R V V V V V V V V V V1 1 1 1 1 1 1 1 1 V4 4 4 4 4 4 4
VR
VR
VR
VR
a a
V4
V V V V V V V V V V V
V4
R
V4
V
V
V V V V V V V V
VL
a a a a a a a a aV
VL
VL
VL
V5
V5
V V V V V V V V V V V
I I I I I I I I a a V V V V V V V V L L L L L L L L L L V2 2 2 2 2 2 2 2 2 2 2 V5 5 5 5 5 5 5
V5
V
V2
V2
V V V V V V
V
V2
V
V
V V V V V V V V
VF
VF
VF
V V V V V V V V V V V
V6
V6
V V V V V V
V3
V3
I I I I I I I I I I I I I a a VF F F F F F F F F F F V3 3 3 3 3 3 3 3 3 3 3 V6 6 6 6 6 6 6
a a a a a a a a a a a aV
V6
V3
A
aV
aVV
V
V V V V V V V V VR
a a a a a
V V V V V V V V V V V
V4
V4
I I I I I I I I I aV R R R R R R R R R V V 1 1 1 1 1 1 1 1 V4 4 4 4 4 4 4 4 4 4 4
V V V V V V V V V V V V1
V4
V V
2 2 2 2 2 2 2 2 2
V5
V5
V5
V
V V V V V V V V V V V
V V V V V V V VL
I I I I II I I II II I I I I I I aV L L L L L V V V V V V V V V V V V2 V5 5 5 5 5 5 5 5 5 5 5
aV
a a a a a a
aV
aVV
V6
V6
V V V V V V V VR
aVV
a a a a a
V6
3 3 3 3 3 3 3 3 3
aV
V V
I I I I III III III III I I I I I I I aV R R R R R R R R R V V V V V V V V V V V V3 V V V V V V V V V V V 6 6 6 6 6 6 6 6 6 6
V
V6
V
B
i f f f f f f f
e
ed
d
d
V1
lip
lip
d d d d d d d d
ed
ed
V11 1 lip pee ed
V V V V V V V V
V1
ppp
pp
p
pp
p
p p p p
pp
p
p p p p
pe
pe
p
pe
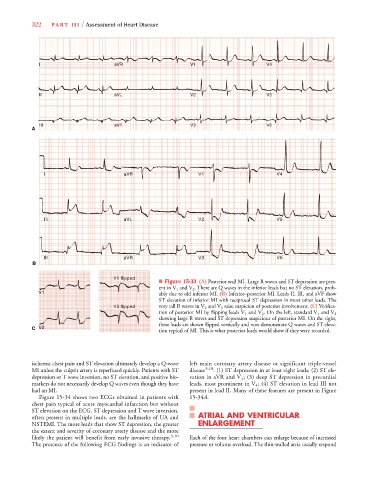
■ Figure 15-33 (A) Posterior wall MI. Large R waves and ST depression are pres-
V
ent in V 1 and V 2 . There are Q waves in the inferior leads but no ST elevation, prob-
V1
V1 ably due to old inferior MI. (B) Inferior–posterior MI. Leads II, III, and aVF show
V11
V1
V V
ST elevation of inferior MI with reciprocal ST depression in most other leads. The
V
V
V V V V V V V V V V
V2 2 2 2 2 2 2 lip pe ed very tall R waves in V 2 and V 3 raise suspicion of posterior involvement. (C) Verifica-
V2
V2
pe
p
i
pee
lip
li f f f f f f f f f
p p p p p
lip
p
pp
pp
p p p p
pp
ppp
p
p
d
d
d
d
d
V2
d
d
e
ed
ed
dd dd
V V
tion of posterior MI by flipping leads V 1 and V 2 . On the left, standard V 1 and V 2
showing large R waves and ST depression suspicious of posterior MI. On the right,
these leads are shown flipped vertically and now demonstrate Q waves and ST eleva-
V2
V V
V2
V22
C V2
tion typical of MI. This is what posterior leads would show if they were recorded.
ischemic chest pain and ST elevation ultimately develop a Q-wave left main coronary artery disease or significant triple-vessel
MI unless the culprit artery is reperfused quickly. Patients with ST disease 3,10 : (1) ST depression in at least eight leads; (2) ST ele-
depression or T wave inversion, no ST elevation, and positive bio- vation in aVR and V 1 ; (3) deep ST depression in precordial
markers do not necessarily develop Q waves even though they have leads, most prominent in V 4 ; (4) ST elevation in lead III not
had an MI. present in lead II. Many of these features are present in Figure
4
Figure 15-34 shows two ECGs obtained in patients with 15-34A.
4
chest pain typical of acute myocardial infarction but without
ST elevation on the ECG. ST depression and T wave inversion,
often present in multiple leads, are the hallmarks of UA and ATRIAL AND VENTRICULAR
NSTEMI. The more leads that show ST depression, the greater ENLARGEMENT
the extent and severity of coronary artery disease and the more
likely the patient will benefit from early invasive therapy. 3,10 Each of the four heart chambers can enlarge because of increased
The presence of the following ECG findings is an indicator of pressure or volume overload. The thin-walled atria usually respond