
Page 347 - Cardiac Nursing
P. 347
/29
/29
6
6
/09
1
A
/09
32.
q
p
32.
xd
xd
q
q
1
g
e 3
g
g
23
23
e 3
A
0 P
0 P
0:3
0:3
Pa
Pa
M
M
a
In
In
a
t
ara
ara
c.
LWBK340-c15_
LWB
LWB K34 0-c 15_ pp300-332.qxd 6/29/09 10:30 PM Page 323 Aptara Inc.
K34
c.
15_
0-c
30
30
p
p
0-3
0-3
p
p
t
C HAPTER 1 5 / Electrocardiography 323
VR
4
V V V V V V V V
aV
aV
aV
V
V
4 4 4 4
VR
R
V
V
VR
V44
V4
V4
R R R R R
V V V V V V V V V V
I I I I a a a a a VR VI VI VI VII V V V V V V V V V V V V4
V2
V22
V V V V V V V V
VL
V
V2
a a a a a a
aV
aV
V V V V V V V V V V V
aV
VL
VL
V
5
I I I I I I I I aV L L L L L L V2 2 2 2 2 2 V5
5 5 5 5
V
V5
V55
V V V V V V V V V V
VL
V5
I I I I I I I I I I I I aV F F F F F F V3 3 3 3 3 3 V6
V
V
V V V V V V V V
V6
V V V V V V V V V V
V33
V3
6
6 6 6 6
V6
V66
V
VF
VF
V
V V V V V V V V V V V
V3
VF
VF
aV
a a a a a
aV
I I I I VI VI VI VI V V V V V V V V V V VI
A
I I I I I I I I I I I aV R V11 1 1 1 1
V1
V1
V1
V V V V V V V V V V V
aV
VR
VR
V
aVV
a a a a a a a a
VR
V V V V V
V
R
VRR
R R R R R R R R R R R R
V V V V V V V V V V V V V V V4 4 4 4 4 4 4 4 4 4 4
II II II III I I I I I aV L L L L L L L L L V V V V V V V V V V V 2 2 2 2 2 2 2 2 2 V V V V V V V V V V V V V V V5 5 5 5 5 5 5 5 5 5
V V V V V
V
aVV
aV
VL
VL
VLL
VL
V
a a a a a a a a
V2
V2
V2
V22
F F F F F F F F
V
VF
VF
V
VFF
V V V V V
VF
aV
aVV
I I I I II II II II I I I I I I I a a a a a a a a aV F V V V V V V V V V V V V V V V6 6 6 6 6 6 6 6 6 6 6 6
V V V V V V V V V V V
V3 3 3 3 3 3 3 3 3 3
V3
V3
V33
B
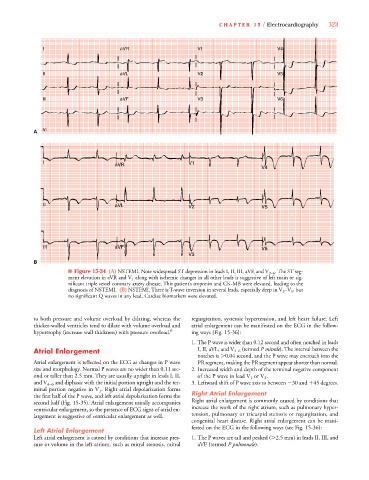
■ Figure 15-34 (A) NSTEMI. Note widespread ST depression in leads I, II, III, aVF, and V 2–6 . The ST seg-
V
ment elevation in aVR and V 1 along with ischemic changes in all other leads is suggestive of left main or sig-
nificant triple vessel coronary artery disease. This patient’s troponin and CK-MB were elevated, leading to the
diagnosis of NSTEMI. (B) NSTEMI. There is T-wave inversion in several leads, especially deep in V 3 –V 5 , but
no significant Q waves in any lead. Cardiac biomarkers were elevated.
to both pressure and volume overload by dilating, whereas the regurgitation, systemic hypertension, and left heart failure. Left
thicker-walled ventricles tend to dilate with volume overload and atrial enlargement can be manifested on the ECG in the follow-
hypertrophy (increase wall thickness) with pressure overload. 6 ing ways (Fig. 15-36):
1. The P wave is wider than 0.12 second and often notched in leads
V
Atrial Enlargement I, II, aVL, and V 4–6 (termed P mitrale). The interval between thee
notches is 0.04 second, and the P wave may encroach into the
Atrial enlargement is reflected on the ECG as changes in P wave PR segment, making the PR segment appear shorter than normal.
size and morphology. Normal P waves are no wider than 0.11 sec- 2. Increased width and depth of the terminal negative component
ond or taller than 2.5 mm. They are usually upright in leads I, II, of the P wave in lead V 1 or V 2 .
V
and V 4–6 and diphasic with the initial portion upright and the ter- 3.Leftward shift of P wave axis to between 30 and
45 degrees.
V
minal portion negative in V 1 . Right atrial depolarization forms
the first half of the P wave, and left atrial depolarization forms the Right Atrial Enlargement
second half (Fig. 15-35). Atrial enlargement usually accompanies Right atrial enlargement is commonly caused by conditions that
ventricular enlargement, so the presence of ECG signs of atrial en- increase the work of the right atrium, such as pulmonary hyper-
largement is suggestive of ventricular enlargement as well. tension, pulmonary or tricuspid stenosis or regurgitation, and
congenital heart disease. Right atrial enlargement can be mani-
fested on the ECG in the following ways (see Fig. 15-36):
Left Atrial Enlargement
Left atrial enlargement is caused by conditions that increase pres- 1. The P waves are tall and peaked ( 2.5 mm) in leads II, III, and
e
e
sure or volume in the left atrium, such as mitral stenosis, mitral aVF (termed P pulmonale).