Page 350 - Cardiac Nursing
P. 350

0 P
                                     0 P
                                   0:3
                                   1
                                   0:3
                                          Pa
                                           g
                                          Pa
                                        M
                                        M
                                   1
                           xd
                             6
                           xd
                          q
                          q
                                /09
                                /09
                              /29
                             6
                              /29
                                                  ara
                                                   a
                                                  ara
                                                  t
                                                  t
                                                      c.
                                                      c.
                                                    In
                                                   a
                                                    In
                                                 p
                                            e 3
                                              26
                                            e 3
                                           g
                                           g
                                                 p
                                                 p
                                                A
                                              26
                                                A
         LWB
         LWB K34 0-c 15_ p p pp300-332.qxd  6/29/09  10:30 PM  Page 326 Aptara Inc.
                    30
         LWBK340-c15_
                 15_
               0-c
            K34
                    30
                      0-3
                      0-3
                        32.
                          q
                        32.
                  326    P A R T  III / Assessment of Heart Disease
                                             V
                                             V
                                              R
                                             aVRR
                                             aVR
                                             V
                                              R
                                                                     V1
                                                                                            V4
                                                                     V V
                                                                                            V4
                                                                                            V4
                                                                     V1
                   I I I                     a a a aVR               V1 1 1                 V V 4 4
                                             V
                                             V
                                             V
                                             a a
                                             aVL
                                              L
                                                                     V2
                                                                     V2
                                                                     V2
                                              L
                                                                     V2
                                                                                            V5
                                                                                            V V
                   II II II II               aVL                     V V 2 2                V5 5 5
                                                                                            V V5
                                             aVLVL
                                              F
                                              F
                                                                                             6
                                                                                             6
                                                                                            V6
                                                                                            V V
                                                                                            V6
                    I I I I II I I II II I I I  aVF                  V3                     V6
                                                                     V3
                                                                     V3
                                                                     V3
                                                                                            V6
                                                                      3
                                             aVF
                                             a a
                                             aVFVF
                                                                      3
                                             V
                                             V
                                                                     V V
                                             V
                   VI VI VI VI VI V V
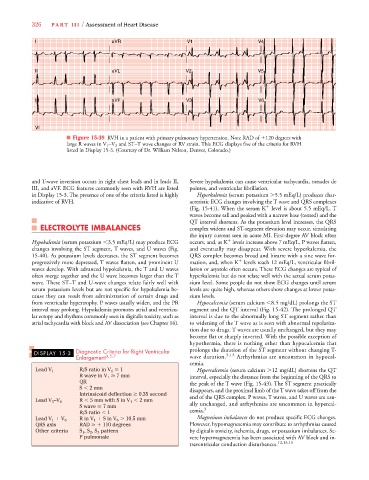
                              ■ Figure 15-39 RVH in a patient with primary pulmonary hypertension. Note RAD of 
120 degrees with
                              large R waves in V 1 –V 3 and ST–T wave changes of RV strain. This ECG displays five of the criteria for RVH
                              listed in Display 15-3. (Courtesy of Dr. William Nelson, Denver, Colorado.)
                  and T-wave inversion occurs in right chest leads and in leads II,  Severe hypokalemia can cause ventricular tachycardia, torsades de
                  III, and aVF. ECG features commonly seen with RVH are listed  pointes, and ventricular fibrillation.
                  in Display 15-3. The presence of one of the criteria listed is highly  Hyperkalemia (serum potassium  5.5 mEq/L) produces char-
                  indicative of RVH.                                  acteristic ECG changes involving the T wave and QRS complexes

                                                                      (Fig. 15-41). When the serum K level is about 5.5 mEq/L, T
                                                                      waves become tall and peaked with a narrow base (tented) and the
                                                                      QT interval shortens. As the potassium level increases, the QRS
                     ELECTROLYTE IMBALANCES                           complex widens and ST-segment elevation may occur, simulating
                                                                      the injury current seen in acute MI. First-degree AV block often

                  Hypokalemia (serum potassium  3.5 mEq/L) may produce ECG  occurs, and, as K levels increase above 7 mEq/L, P waves flatten,
                  changes involving the ST segment, T waves, and U waves (Fig.  and eventually may disappear. With severe hyperkalemia, the
                  15-40). As potassium levels decreases, the ST segment becomes  QRS complex becomes broad and bizarre with a sine wave for-

                  progressively more depressed, T waves flatten, and prominent U  mation, and, when K levels reach 12 mEq/L, ventricular fibril-
                  waves develop. With advanced hypokalemia, the T and U waves  lation or asystole often occurs. These ECG changes are typical of
                  often merge together and the U wave becomes larger than the T  hyperkalemia but do not relate well with the actual serum potas-
                  wave. These ST–T and U-wave changes relate fairly well with  sium level. Some people do not show ECG changes until serum
                  serum potassium levels but are not specific for hypokalemia be-  levels are quite high, whereas others show changes at lower potas-
                  cause they can result from administration of certain drugs and  sium levels.
                  from ventricular hypertrophy. P waves usually widen, and the PR  Hypocalcemia (serum calcium  8.5 mg/dL) prolongs the ST
                  interval may prolong. Hypokalemia promotes atrial and ventricu-  segment and the QT interval (Fig. 15-42). The prolonged QT
                  lar ectopy and rhythms commonly seen in digitalis toxicity, such as  interval is due to the abnormally long ST segment rather than
                  atrial tachycardia with block and AV dissociation (see Chapter 16).  to widening of the T wave as is seen with abnormal repolariza-
                                                                      tion due to drugs. T waves are usually unchanged, but they may
                                                                      become flat or sharply inverted. With the possible exception of
                                                                      hypothermia, there is nothing other than hypocalcemia that
                   DISPLAY 15-3  Diagnostic Criteria for Right Ventricular  prolongs the duration of the ST segment without changing T-
                                                                                  3,12
                                 Enlargement 3,5,7                    wave duration.  Arrhythmias are uncommon in hypocal-
                                                                      cemia.
                    Lead V 1      R/S ratio in V 1   1                  Hypercalcemia (serum calcium  12 mg/dL) shortens the QT
                                  R wave in V 1   7 mm                interval, especially the distance from the beginning of the QRS to
                                  QR                                  the peak of the T wave (Fig. 15-43). The ST segment practically
                                  S   2 mm                            disappears, and the proximal limb of the T wave takes off from the
                                  Intrinsicoid deflection   0.35 second  end of the QRS complex. P waves, T waves, and U waves are usu-
                    Lead V 5 –V 6  R   5 mm with S in V 1   2 mm      ally unchanged, and arrhythmias are uncommon in hypercal-
                                  S wave   7 mm                            3
                                  R/S ratio   1                       cemia.
                    Lead V 1 
 V 6  R in V 1 
 S in V 6   10.5 mm       Magnesium imbalances do not produce specific ECG changes.
                    QRS axis      RAD   
 110 degrees                 However, hypomagnesemia may contribute to arrhythmias caused
                    Other criteria  S 1 , S 2 , S 3 pattern           by digitalis toxicity, ischemia, drugs, or potassium imbalances. Se-
                                  P pulmonale                         vere hypermagnesemia has been associated with AV block and in-
                                                                      traventricular conduction disturbances. 12,13,15
   345   346   347   348   349   350   351   352   353   354   355