
Page 498 - Cardiac Nursing
P. 498
74
74
e 4
P
g
8 A
p46
ara
0-5
Apt
9/0
0
9/2
8:2
009
M
P
10.
qxd
10.
K34
21_
0-c
K34
L L LWB
LWB K34 0-c 21_ p46 0-5 10. qxd 0 9/0 9/2 009 0 0 8:2 8 A M P a a g e 4 74 Apt ara
LWBK340-c21_21_p460-510.qxd 09/09/2009 08:28 AM Page 474 Aptara
474 P A R T III / Assessment of Heart Disease
Thermistor connector Balloon inflation Proximal infusion
valve port @ 31 cm
Thermistor
Distal lumen hub Proximal injectate Proximal injectate Balloon
lumen hub port @ 30 cm
Proximal infusion
lumen hub
Distal lumen
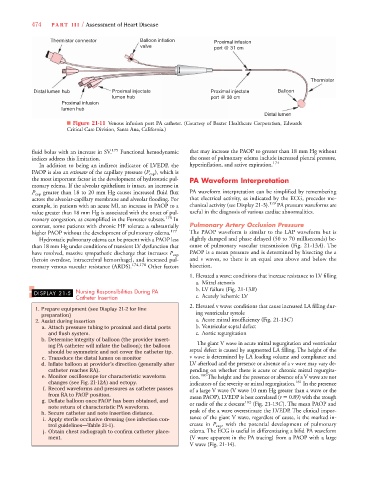
■ Figure 21-11 Venous infusion port PA catheter. (Courtesy of Baxter Healthcare Corporation, Edwards
Critical Care Division, Santa Ana, California.)
fluid bolus with an increase in SV. 175 Functional hemodynamic that may increase the PAOP to greater than 18 mm Hg without
indices address this limitation. the onset of pulmonary edema include increased pleural pressure,
In addition to being an indirect indicator of LVEDP, the hyperinflation, and active expiration. 174
P P
PAOP is also an estimate of the capillary pressure (P cap ), which is
the most important factor in the development of hydrostatic pul- PA Waveform Interpretation
monary edema. If the alveolar epithelium is intact, an increase in
P cap greater than 18 to 20 mm Hg causes increased fluid flux PA waveform interpretation can be simplified by remembering
P
across the alveolar-capillary membrane and alveolar flooding. For that electrical activity, as indicated by the ECG, precedes me-
example, in patients with an acute MI, an increase in PAOP to a chanical activity (see Display 21-3). 179 PA pressure waveforms are
value greater than 18 mm Hg is associated with the onset of pul- useful in the diagnosis of various cardiac abnormalities.
monary congestion, as exemplified in the Forrester subsets. 176 In
contrast, some patients with chronic HF tolerate a substantially Pulmonary Artery Occlusion Pressure
higher PAOP without the development of pulmonary edema. 177 The PAOP waveform is similar to the LAP waveform but is
Hydrostatic pulmonary edema can be present with a PAOP less slightly damped and phase delayed (50 to 70 milliseconds) be-
than 18 mm Hg under conditions of transient LV dysfunction that cause of pulmonary vascular transmission (Fig. 21-13A). The
P P PAOP is a mean pressure and is determined by bisecting the a
have resolved, massive sympathetic discharge that increases P cap
(heroin overdose, intracerebral hemorrhage), and increased pul- and v waves, so there is an equal area above and below the
monary venous vascular resistance (ARDS). 174,178 Other factors bisection.
1. Elevated a wave: conditions that increase resistance to LV filling
a. Mitral stenosis
DISPLAY 21-5 Nursing Responsibilities During PA b. LV failure (Fig. 21-13B)
Catheter Insertion c. Acutely ischemic LV
2.Elevated v wave: conditions that cause increased LA filling dur-
1. Prepare equipment (see Display 21-2 for line
preparation) ing ventricular systole
2. Assist during insertion a. Acute mitral insufficiency (Fig. 21-13C )
a. Attach pressure tubing to proximal and distal ports b. Ventricular septal defect
and flush system. c. Aortic regurgitation
b. Determine integrity of balloon (the provider insert-
ing PA catheter will inflate the balloon); the balloon The giant V wave in acute mitral regurgitation and ventricular
should be symmetric and not cover the catheter tip. septal defect is caused by augmented LA filling. The height of the
c. Transduce the distal lumen on monitor v wave is determined by LA loading volume and compliance and
d. Inflate balloon at provider’s direction (generally after LV afterload and the presence or absence of a v wave may vary de-
catheter reaches RA). pending on whether there is acute or chronic mitral regurgita-
e. Monitor oscilloscope for characteristic waveform tion. 180 The height and the presence or absence of a V wave are not
2
2
changes (see Fig. 21-12A) and ectopy. indicators of the severity or mitral regurgitation. 181 In the presence
f. Record waveforms and pressures as catheter passes of a large V wave (V wave 10 mm Hg greater than a wave or the
from RA to PAOP position. mean PAOP), LVEDP is best correlated (r 0.89) with the trough
g. Deflate balloon once PAOP has been obtained, and or nadir of the x descent 182 (Fig. 21-13C). The mean PAOP and
note return of characteristic PA waveform.
h. Secure catheter and note insertion distance. peak of the a wave overestimate the LVEDP. The clinical impor-
i. Apply sterile occlusive dressing (see infection con- tance of the giant V wave, regardless of cause, is the marked in-
P
trol guidelines—Table 21-1). crease in P cap , with the potential development of pulmonary
j. Obtain chest radiograph to confirm catheter place- edema. The ECG is useful in differentiating a bifid PA waveform
ment. (V wave apparent in the PA tracing) from a PAOP with a large
V wave (Fig. 21-14).