
Page 595 - 9780077418427.pdf
P. 595
/Volume/201/MHDQ233/tat78194_disk1of1/0073378194/tat78194_pagefile
tiL12214_ch23_565-596.indd Page 572 9/23/10 11:07 AM user-f465
tiL12214_ch23_565-596.indd Page 572 9/23/10 11:07 AM user-f465 /Volume/201/MHDQ233/tat78194_disk1of1/0073378194/tat78194_pagefiles
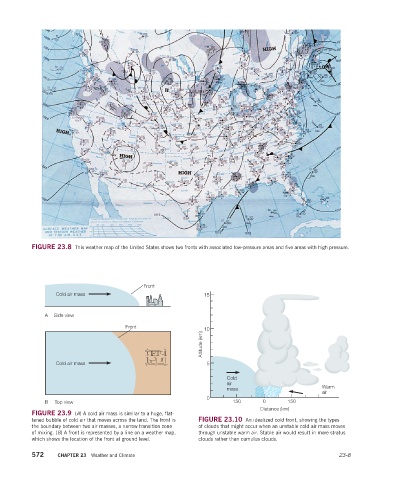
FIGURE 23.8 This weather map of the United States shows two fronts with associated low-pressure areas and five areas with high pressure.
Front
Cold air mass 15
A Side view
Front 10
Altitude (km)
Cold air mass 5
Cold
air
mass Warm
air
0
B Top view 150 0 150
Distance (km)
FIGURE 23.9 (A) A cold air mass is similar to a huge, flat-
tened bubble of cold air that moves across the land. The front is FIGURE 23.10 An idealized cold front, showing the types
the boundary between two air masses, a narrow transition zone of clouds that might occur when an unstable cold air mass moves
of mixing. (B) A front is represented by a line on a weather map, through unstable warm air. Stable air would result in more stratus
which shows the location of the front at ground level. clouds rather than cumulus clouds.
572 CHAPTER 23 Weather and Climate 23-8