
Page 247 - Python Data Science Handbook
P. 247
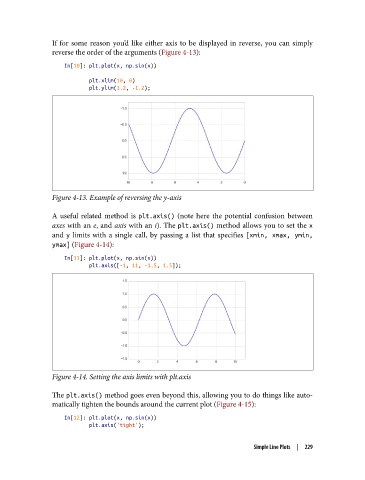
If for some reason you’d like either axis to be displayed in reverse, you can simply
               reverse the order of the arguments (Figure 4-13):

                   In[10]: plt.plot(x, np.sin(x))
                           plt.xlim(10, 0)
                           plt.ylim(1.2, -1.2);


               Figure 4-13. Example of reversing the y-axis

               A useful related method is plt.axis()  (note here the potential confusion between
               axes with an e, and axis with an i). The plt.axis() method allows you to set the x
               and y  limits with a single call, by passing a list that specifies [xmin, xmax, ymin,
               ymax] (Figure 4-14):

                   In[11]: plt.plot(x, np.sin(x))
                           plt.axis([-1, 11, -1.5, 1.5]);


               Figure 4-14. Setting the axis limits with plt.axis

               The plt.axis() method goes even beyond this, allowing you to do things like auto‐
               matically tighten the bounds around the current plot (Figure 4-15):
                   In[12]: plt.plot(x, np.sin(x))
                           plt.axis('tight');

                                                                       Simple Line Plots  |  229