
Page 270 - Python Data Science Handbook
P. 270
# lines is a list of plt.Line2D instances
plt.legend(lines[:2], ['first', 'second']);
Figure 4-45. Customization of legend elements
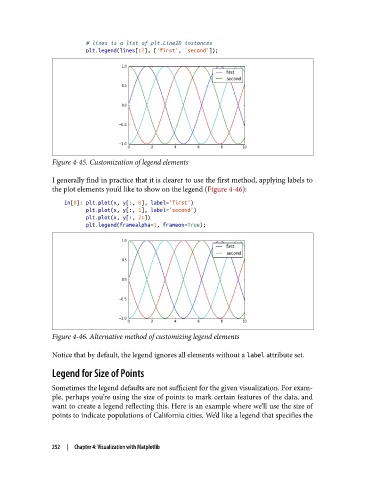
I generally find in practice that it is clearer to use the first method, applying labels to
the plot elements you’d like to show on the legend (Figure 4-46):
In[8]: plt.plot(x, y[:, 0], label='first')
plt.plot(x, y[:, 1], label='second')
plt.plot(x, y[:, 2:])
plt.legend(framealpha=1, frameon=True);
Figure 4-46. Alternative method of customizing legend elements
Notice that by default, the legend ignores all elements without a label attribute set.
Legend for Size of Points
Sometimes the legend defaults are not sufficient for the given visualization. For exam‐
ple, perhaps you’re using the size of points to mark certain features of the data, and
want to create a legend reflecting this. Here is an example where we’ll use the size of
points to indicate populations of California cities. We’d like a legend that specifies the
252 | Chapter 4: Visualization with Matplotlib