
Page 274 - Python Data Science Handbook
P. 274
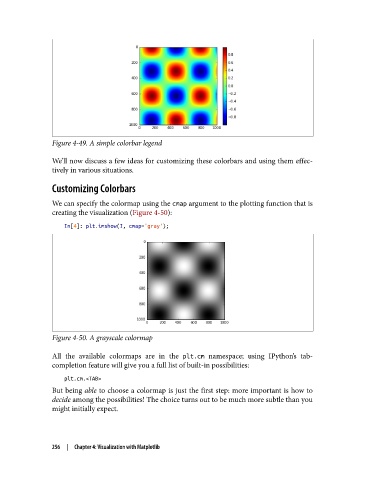
Figure 4-49. A simple colorbar legend

               We’ll now discuss a few ideas for customizing these colorbars and using them effec‐
               tively in various situations.

               Customizing Colorbars

               We can specify the colormap using the cmap argument to the plotting function that is
               creating the visualization (Figure 4-50):
                   In[4]: plt.imshow(I, cmap='gray');


               Figure 4-50. A grayscale colormap


               All the available colormaps are in the plt.cm  namespace; using IPython’s tab-
               completion feature will give you a full list of built-in possibilities:

                   plt.cm.<TAB>
               But being able to choose a colormap is just the first step: more important is how to
               decide among the possibilities! The choice turns out to be much more subtle than you
               might initially expect.


               256  |  Chapter 4: Visualization with Matplotlib