
Page 278 - Python Data Science Handbook
P. 278
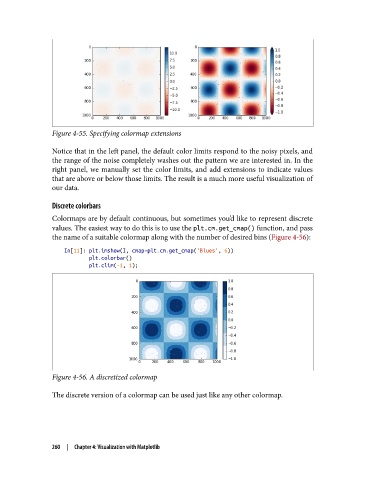
Figure 4-55. Specifying colormap extensions

               Notice that in the left panel, the default color limits respond to the noisy pixels, and
               the range of the noise completely washes out the pattern we are interested in. In the
               right panel, we manually set the color limits, and add extensions to indicate values
               that are above or below those limits. The result is a much more useful visualization of
               our data.
               Discrete colorbars

               Colormaps are by default continuous, but sometimes you’d like to represent discrete
               values. The easiest way to do this is to use the plt.cm.get_cmap() function, and pass
               the name of a suitable colormap along with the number of desired bins (Figure 4-56):

                   In[11]: plt.imshow(I, cmap=plt.cm.get_cmap('Blues', 6))
                           plt.colorbar()
                           plt.clim(-1, 1);


               Figure 4-56. A discretized colormap

               The discrete version of a colormap can be used just like any other colormap.


               260  |  Chapter 4: Visualization with Matplotlib