
Page 279 - Python Data Science Handbook
P. 279
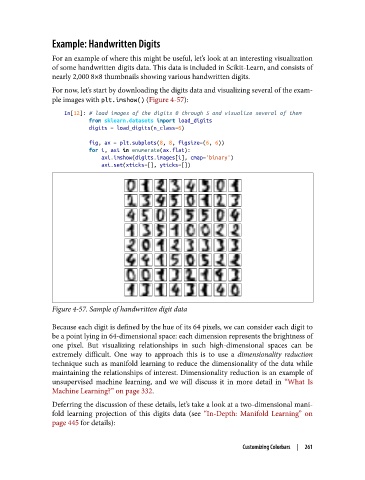
Example: Handwritten Digits

               For an example of where this might be useful, let’s look at an interesting visualization
               of some handwritten digits data. This data is included in Scikit-Learn, and consists of
               nearly 2,000 8×8 thumbnails showing various handwritten digits.

               For now, let’s start by downloading the digits data and visualizing several of the exam‐
               ple images with plt.imshow() (Figure 4-57):

                   In[12]: # load images of the digits 0 through 5 and visualize several of them
                           from sklearn.datasets import load_digits
                           digits = load_digits(n_class=6)
                           fig, ax = plt.subplots(8, 8, figsize=(6, 6))
                           for i, axi in enumerate(ax.flat):
                               axi.imshow(digits.images[i], cmap='binary')
                               axi.set(xticks=[], yticks=[])


               Figure 4-57. Sample of handwritten digit data

               Because each digit is defined by the hue of its 64 pixels, we can consider each digit to
               be a point lying in 64-dimensional space: each dimension represents the brightness of
               one pixel. But visualizing relationships in such high-dimensional spaces can be
               extremely difficult. One way to approach this is to use a dimensionality reduction
               technique such as manifold learning to reduce the dimensionality of the data while
               maintaining the relationships of interest. Dimensionality reduction is an example of
               unsupervised machine learning, and we will discuss it in more detail in “What Is
               Machine Learning?” on page 332.

               Deferring the discussion of these details, let’s take a look at a two-dimensional mani‐
               fold learning projection of this digits data (see “In-Depth: Manifold Learning”  on
               page 445 for details):


                                                                    Customizing Colorbars  |  261