
Page 281 - Python Data Science Handbook
P. 281
In[1]: %matplotlib inline
import matplotlib.pyplot as plt
plt.style.use('seaborn-white')
import numpy as np
plt.axes: Subplots by Hand
The most basic method of creating an axes is to use the plt.axes function. As we’ve
seen previously, by default this creates a standard axes object that fills the entire fig‐
ure. plt.axes also takes an optional argument that is a list of four numbers in the
figure coordinate system. These numbers represent [bottom, left, width,
height] in the figure coordinate system, which ranges from 0 at the bottom left of the
figure to 1 at the top right of the figure.
For example, we might create an inset axes at the top-right corner of another axes by
setting the x and y position to 0.65 (that is, starting at 65% of the width and 65% of
the height of the figure) and the x and y extents to 0.2 (that is, the size of the axes is
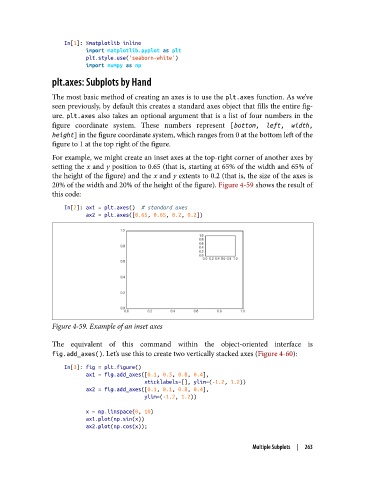
20% of the width and 20% of the height of the figure). Figure 4-59 shows the result of
this code:
In[2]: ax1 = plt.axes() # standard axes
ax2 = plt.axes([0.65, 0.65, 0.2, 0.2])
Figure 4-59. Example of an inset axes
The equivalent of this command within the object-oriented interface is
fig.add_axes(). Let’s use this to create two vertically stacked axes (Figure 4-60):
In[3]: fig = plt.figure()
ax1 = fig.add_axes([0.1, 0.5, 0.8, 0.4],
xticklabels=[], ylim=(-1.2, 1.2))
ax2 = fig.add_axes([0.1, 0.1, 0.8, 0.4],
ylim=(-1.2, 1.2))
x = np.linspace(0, 10)
ax1.plot(np.sin(x))
ax2.plot(np.cos(x));
Multiple Subplots | 263