
Page 283 - Python Data Science Handbook
P. 283
The command plt.subplots_adjust can be used to adjust the spacing between
these plots. The following code (the result of which is shown in Figure 4-62) uses the
equivalent object-oriented command, fig.add_subplot():
In[5]: fig = plt.figure()
fig.subplots_adjust(hspace=0.4, wspace=0.4)
for i in range(1, 7):
ax = fig.add_subplot(2, 3, i)
ax.text(0.5, 0.5, str((2, 3, i)),
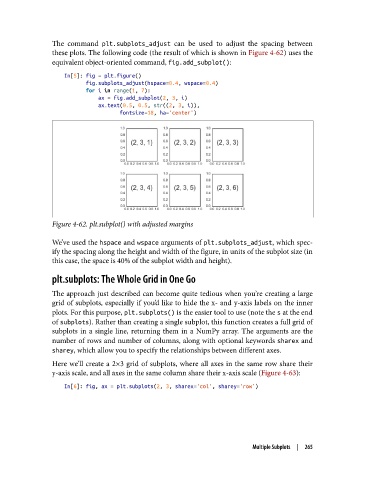
fontsize=18, ha='center')
Figure 4-62. plt.subplot() with adjusted margins
We’ve used the hspace and wspace arguments of plt.subplots_adjust, which spec‐
ify the spacing along the height and width of the figure, in units of the subplot size (in
this case, the space is 40% of the subplot width and height).
plt.subplots: The Whole Grid in One Go
The approach just described can become quite tedious when you’re creating a large
grid of subplots, especially if you’d like to hide the x- and y-axis labels on the inner
plots. For this purpose, plt.subplots() is the easier tool to use (note the s at the end
of subplots). Rather than creating a single subplot, this function creates a full grid of
subplots in a single line, returning them in a NumPy array. The arguments are the
number of rows and number of columns, along with optional keywords sharex and
sharey, which allow you to specify the relationships between different axes.
Here we’ll create a 2×3 grid of subplots, where all axes in the same row share their
y-axis scale, and all axes in the same column share their x-axis scale (Figure 4-63):
In[6]: fig, ax = plt.subplots(2, 3, sharex='col', sharey='row')
Multiple Subplots | 265