
Page 282 - Python Data Science Handbook
P. 282
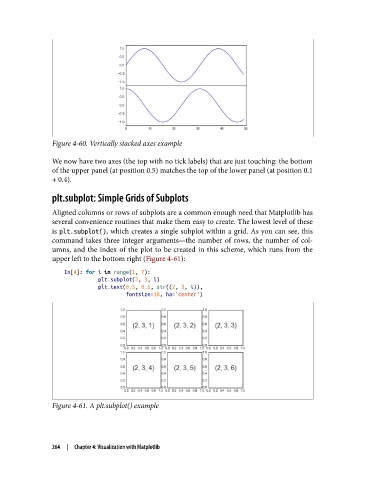
Figure 4-60. Vertically stacked axes example

               We now have two axes (the top with no tick labels) that are just touching: the bottom
               of the upper panel (at position 0.5) matches the top of the lower panel (at position 0.1
               + 0.4).

               plt.subplot: Simple Grids of Subplots

               Aligned columns or rows of subplots are a common enough need that Matplotlib has
               several convenience routines that make them easy to create. The lowest level of these
               is plt.subplot(), which creates a single subplot within a grid. As you can see, this
               command takes three integer arguments—the number of rows, the number of col‐
               umns, and the index of the plot to be created in this scheme, which runs from the
               upper left to the bottom right (Figure 4-61):
                   In[4]: for i in range(1, 7):
                              plt.subplot(2, 3, i)
                              plt.text(0.5, 0.5, str((2, 3, i)),
                                       fontsize=18, ha='center')


               Figure 4-61. A plt.subplot() example


               264  |  Chapter 4: Visualization with Matplotlib