
Page 331 - Python Data Science Handbook
P. 331
Now let’s take a look at how it works with Seaborn. As we will see, Seaborn has many
of its own high-level plotting routines, but it can also overwrite Matplotlib’s default
parameters and in turn get even simple Matplotlib scripts to produce vastly superior
output. We can set the style by calling Seaborn’s set() method. By convention, Sea‐
born is imported as sns:
In[4]: import seaborn as sns
sns.set()
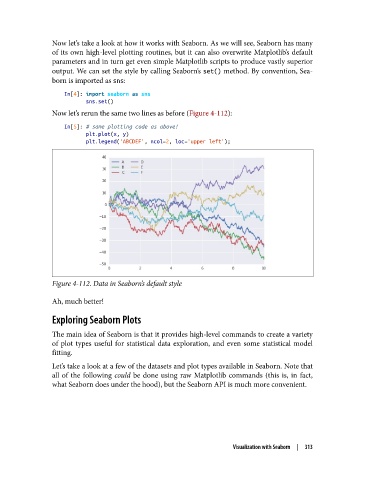
Now let’s rerun the same two lines as before (Figure 4-112):
In[5]: # same plotting code as above!
plt.plot(x, y)
plt.legend('ABCDEF', ncol=2, loc='upper left');
Figure 4-112. Data in Seaborn’s default style
Ah, much better!
Exploring Seaborn Plots
The main idea of Seaborn is that it provides high-level commands to create a variety
of plot types useful for statistical data exploration, and even some statistical model
fitting.
Let’s take a look at a few of the datasets and plot types available in Seaborn. Note that
all of the following could be done using raw Matplotlib commands (this is, in fact,
what Seaborn does under the hood), but the Seaborn API is much more convenient.
Visualization with Seaborn | 313