
Page 340 - Python Data Science Handbook
P. 340
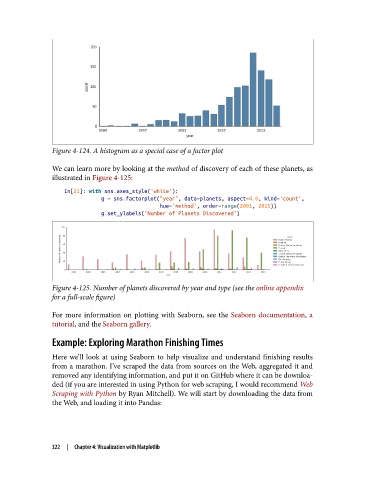
Figure 4-124. A histogram as a special case of a factor plot

               We can learn more by looking at the method of discovery of each of these planets, as
               illustrated in Figure 4-125:
                   In[21]: with sns.axes_style('white'):
                               g = sns.factorplot("year", data=planets, aspect=4.0, kind='count',
                                                  hue='method', order=range(2001, 2015))
                               g.set_ylabels('Number of Planets Discovered')


               Figure 4-125. Number of planets discovered by year and type (see the online appendix
               for a full-scale figure)

               For more information on plotting with Seaborn, see the Seaborn documentation, a
               tutorial, and the Seaborn gallery.

               Example: Exploring Marathon Finishing Times

               Here we’ll look at using Seaborn to help visualize and understand finishing results
               from a marathon. I’ve scraped the data from sources on the Web, aggregated it and
               removed any identifying information, and put it on GitHub where it can be downloa‐
               ded (if you are interested in using Python for web scraping, I would recommend Web
               Scraping with Python by Ryan Mitchell). We will start by downloading the data from
               the Web, and loading it into Pandas:


               322  |  Chapter 4: Visualization with Matplotlib